Search Bob Brinker Fan Club Blogs

Friday, February 29, 2008

Bob Brinker Fan Club Update - February 29, 2008

We just emailed our "Bob Brinker Fan Club Update - February 29, 2008" to everyone on our "Bob Brinker Fan Club" distribution list.

If you would like to get on this list, then click this link.

If you are already on this list and you did not get your update, then check your junk mail and trash folders. Make sure you have TalkAboutMoney@gmail.com set as an "allowed sender" so your internet service provider (ISP) doesn't block our mass mailing to you as spam (yes, this happens.) You might have to call your ISP to find out how to add our email address to your allowed sender (this is NOT SPAM) list.

"Moneytalk hosted by Bob Brinker" Update for February 29, 2008:

Happy Leap Day! (Holiday List)

Older Articles of note:

Subscribe NOW and get the February 2008 Issue of "Kirk Lindstrom's Investment Newsletter" for FREE! ! (more information)

Friday, February 22, 2008

Bob Brinker Likes Low 1300s According to Peter Brimelow

Yesterday Peter Brimelow reported that his "Bold Bulls are bloodied but unbowed." He says the bold bulls are all "shaken by the economy's deterioration, but still positive long-term."

About Bob Brinker, Brimelow wrote:
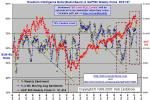
Brinker said recently: "Marketimer views the establishment of a correction bottom as a process which unfolds over a given period of time. This process involves the initial establishment of a closing S&P 500 Index low, followed by a short rally, followed by a test of the area of the previously established low on reduced trading volume. The initial closing low in the current stock market correction process occurred on Jan. 22, when the S&P 500 Index closed at 1310.50. The market subsequently rallied for eight days, at which point it began the process of testing the area of the Jan. 22 closing low."

"In our view, the correction bottoming process has proceeded with a high degree of historical consistency to date. We have witnessed a decided reduction in selling pressure during the testing process, which is essential to a successful outcome. We now rate the stock market attractive for purchase on any weakness that occurs in the current area of the S&P 500 Index low 1,300s, or any minor weakness that occurs below that level."

Market timer's summary: "As has been the case with every correction since August of 2007, several stock market pundits are claiming that a bear market is underway. We do not believe this is the case. We expect the S&P 500 Index to work its way into record new high ground by late this year or in 2009."
It should be noted that with the S&P500 at 1411, Bob Brinker sent out a bulletin to his subscribers on August 16, 2007 that said:
"Any further testing of the area of the correction lows, which we expect to be close to the current S&P 500 Index level (1411), is regarded as an additional buying opportunity for subscribers looking to add to stock market holdings."

and

"Marketimer expects the S&P 500 Index to register new historic record highs as we move forward into next year."
Click image courtesy of stockcharts.com to see it full sized

Bob Brinker has recommended a fully invested position all this time so it is good news for bullish investors that Bob Brinker is still bullish for the long term.

Of the other two "bold bulls" Index Rx remains bullish like Brinker:
  • "Don't let the proclamations of experts frighten you into straying from your chosen strategies. Stay the course; we will be vindicated."

while Richard Band of "Profitable Investing" is defensive:

  • "I continue to recommend a defensive posture for the model portfolio ... Buy gradually and cautiously, focusing on high quality blue-chip stocks (preferably those with the strongest earnings prospects for the year ahead).

    Currently, Band is 69% stocks, 31% fixed income. One stock recommendation is International Business Machines (IBM)

    Band writes: "Buy at $107 or less for a potential return of 20%-30% in the next 12 months."

Visit our Facebook Bob Brinker Discussion Forum at "Investing for the Long Term" to ask questions or discuss this article.

Disclaimer: I own IBM with huge gains from a big buy back in 1994 at about $11 a share when IBM was having major problems since its 1987 peak much like we are seeing today for the NASDAQ100 technology index (QQQ) that remains down over 60% from its 2000 peak. I also have shares from the 1980s via a DRIP (dividend reinvestment plan) that have done very well overall despite the bad times between 1987 and 1994.

==>Highest Yield CDs with FDIC <==


Since 12/31/98 "Kirk's Newsletter Explore Portfolio" is UP 159% (a double plus another 59%!!) vs. the S&P500 UP a tiny 8.6% vs. NASDAQ UP a tiny 3.5% (All through 12/31/09)

In 2009, "Kirk's Newsletter Explore Portfolio" gained 33.5% vs. the DJIA up 18.8%
(FREE Sample Issue)

HURRY! Subscribe NOW and get the CURRENT Month's Issue for FREE!
(Just mention this article and I'll start your 1 year, 12 issue subscription with the next month's issue.)


Wednesday, February 20, 2008

January Inflation and Housing Numbers

After today's data, I doubt even Bob Brinker can continue to say inflation is low. The US Labor Department reported inflation as measured by the Consumer Price Index (CPI) remained elevated in January. Selected highlights of the details at Consumer Price Index Summary:
  • January CPI up 0.4%. In the past when this was only 0.1%, Bob Brinker has "annualized" this number by multiplying it by 12. Multiply 0.4% by Bob's 12 and we get an annualized inflation rate of 4.8%!
  • Due to seasonal effects, December CPI was revised up to 0.4% from its earlier estimate of 0.3%
  • Excluding volatile food and energy, January Core CPI was up 0.3%, the largest gain since June 2006
  • Year-over-year CPI up 4.3% in January.
  • Year-over-year core inflation is up 2.5% over the same period, the fastest pace since February 2007.

Inflation Details from CBS Marketwatch:

  • Energy prices rose 0.7% in January after much larger increases in the past two months.
  • Gasoline prices rose 1.2% after seasonal adjustment. Natural-gas prices rose 2.2%.
  • Food prices rose 0.7% in January, the largest increase since last February.
  • The gain in the core rate reflects accelerated prices for apparel, medical care, recreation, and education.
  • Shelter prices, which represent about 30% of the CPI, rose 0.3% in January.
  • Transportation prices rose 0.5%, led by higher fuel prices.
  • Medical-care prices increased 0.5%, as prescription drug prices rose 0.7%, the largest gain in a year.
  • Apparel prices rose 0.4% after seasonal adjustments. Airline fares rose 0.8% in the month.
  • Food prices were unchanged in January.

Housing

Housing Starts UP 0.8% vs down 14.8% in Decenmber

Building Permits down 3.0% vs down 7.1% in December. On a seasonally adjusted basis, building permits are running at a rate of 1.08M, the lowest reading since November 1991!

Slow single family housing means people need appartments to live in. Single-family housing starts fell by 5.2% in January, but starts on structures with two or more units rose by 22.3%.

Yesterday the National Association of Home Builders (NAHB) reported that the mood of U.S. homebuilders improved slightly for a second straight month. The NAHB reported their home builders' housing market index rose to 20 in February from 19 in January.


Visit our Facebook Bob Brinker Discussion Forum at "Investing for the Long Term" to ask questions or discuss this article.
.

Sunday, February 17, 2008

Operating and Actual Earnings Estimates for 2008

One potential flaw in Bob Brinker's Long Term Stock Market Timing Model is he looks at operating earnings which ignores the write-offs. Many companies use write-offs as part of their business model. That is they make a ton of money in the good years then in the bad years they lay off staff and get out of marginal businesses and "write off the costs" to lay people off and exit business.

Each month in "Kirk Lindstrom's Investment Newsletter" I update the page I call "Fed Model Update." The “Fed Model” refers to a simple model the Federal Reserve uses which compares the earnings yield of the S&P500 with the 10-year Treasury bond. The model says the stock market is over valued if the earnings yield (defined as the total earnings of the S&P500 divided by its price) is lower than the yield of 10-year Treasury bonds, currently yielding 3.77%.

Below is my comparision for this month. Note how the year-0ver-year estimate for operating earnings growh is a whopping 18%.

2007 Operating EPS (bottom up est.) = $84.13
Year over Year Dollar Growth = -$3.59
Year over Year Percent Growth = -4.1%
PE Ratio = 16.0
Earnings Yield 6.2%

2008 Operating EPS (bottom up) = $99.50
Year over Year Dollar Growth = $15.37
Year over Year Percent Growth = 18.3%
PE Ratio = 13.6
Earnings Yield 7.4%

2007 GAAP EPS = $71.56
Year over Year Dollar Growth = -$9.95
Year over Year Percent Growth = -12.2%
PE Ratio = 18.9
Earnings Yield 5.3%

2008 As reported GAAP EPS = $71.20
Year over Year Dollar Growth = -$0.36
Year over Year Percent Growth = -0.5%
PE Ratio = 19.0
Earnings Yield 5.3%

Fearful investors won't get too excited about the market until it starts to look past the write-offs that have crushed GAAP earnings.

This chart shows TTM (trailing twelve month) GAAP earnings.


The bad news bears think the decline in earings is only starting while bulls like Bob Brinker believe we are having a temporary downturn in earings like we saw in early 2003 before we resume earings growth.

GAAP stands for “Generally Accepted Accounting Principles”

Visit our Facebook Sentiment Forum at "Investing for the Long Term" to ask questions or discuss the data.

==>Highest Yield CDs with FDIC <==

Wednesday, February 13, 2008

Bearish Investors' Intelligence Survey Data Good For Us Contrarians

One of Bob Brinker's key "sentiment indicators" is the Investors' Intellegence survey data of Bulls minus Bears. One of the oldest weekly sentiment indicators is the “Investors Intelligence Survey“ or IIS. The IIS began in January 1963 by A.W. Cohen and has been published every week ever since. Graphs of the Investors' Intellegence survey data of Bulls minus Bears versus the market are key sentiment indicators for stock market technical analysis.

I have been charting this data since 1998. A spike on my charts of "Investors' Intelligence (II) Bull Bear Survey data" is lower than the March 2003 spike and about equal to the July 2006 spike. ALL spikes this low or lower led to significant rallies of several months or more, including the spike in 2001 and the 20% correction in 1998.

I just updated the charts for "II vs DIJA" and "II vs S&P500" at Investors' Intelligence Sentiment Indicator where I have graphs of the bulls over bulls minus bears and the four week moving average of that data charted back to 1998.

Visit our Facebook Sentiment Forum at "Investing for the Long Term" to ask questions or discuss the data.


drugstore.com, inc.

drugstore.com, inc.

Saturday, February 02, 2008

Bob Brinker Shadow Stock Market Timing Model Update

Bob Norton has udated the "Bob Brinker Shadow Long Term Stock Market Timing Model" and reports it "remains in favorable territory as we move into February, 2008."

This is a "A Special Report" by Bob Norton for Bob Brinker Fan Club readers. You can read the whole report here.

The "Shadow" Long Term Stock Market Timing Model now has 3 bullish indicators and one neutral.

Bob also swrites:

  • "I believe we are in the process of forming a bottom in the S&P, possibly within the general level of 1275-1300. The fact that we are presently at 1395 is great news, but it would seem too easy to conclude that we would move straight up to the mid 1500s without some probing and testing of the recent bottom. Watch for a test of the 1275-1300 level. Hopefully selling pressure will be exhausted, and will confirm the march toward the mid 1500 recovery area later in the year.Perhaps Bob Brinker may issue yet ANOTHER buying opportunity in this retest area!"


I wrote:

  • It is a coin toss at best. If you study Brinker's "gift horse" and "MOABO" buy levels through history, about half of them hit and half miss. Bob Brinker issued a buy under 1380 in 2007 after the market rose above that level to go on and make new highs. When the market was in the mid 1500's without a drop again below 1380, Brinker raised his lump sum buy level to the"mid 1400's. After that, the market crashed to the "low 1300's or about 18% from intraday peak to bottom, so far. Brinker took that mid 1400's buy level off via a special bulletin when the market was at 1325. At that price, he said to once again dollar cost average while he attempts to "identify a bottom." I prefer to use asset allocation which had me taking profits when the market was in the 1500's and has had me buying stocks these past weeks at lower than current prices.

This is a "A Special Report" by Bob Norton for Bob Brinker Fan Club readers. You can read the whole report here.

Read Bob's full report to see if you agree with his conclusion and update on the four basic model indicators:

  • Valuation

  • Monetary

  • Sentiment

  • Economic Cycle

Then give Bob your feedback on this in our Bob Brinker Free Discussion Forum at facebook's "Investing for the Long Term" group.

If you want updates on what Brinker is saying on Moneytalk delivered to your email box, often within 24 hours after Sunday's show, then follow the instructions at the Bob Brinker Fan Club.

Click Bob Norton for more articles by Bob Norton.


==>Highest Yield CDs with FDIC <==

FREE Updates Mailing List


We email regular "FREE Bob Brinker Fan Club Updates" to everyone on our "Bob Brinker Fan Club" distribution list. If you would like to get on this list, then click this link.


Top Rated Newsletter


Timer Digest Features
Kirk Lindstrom's Investment Letter
on its Cover

Cick to read the full page article!


US Treasury Rates at a Glance - iBond Rates - LIBOR Rates

Must Read:
Beware of Annuities - Payday Loans Warning