Friday, May 30, 2008

Inflation, Gold and the DOW

Bob Brinker has been negative on gold as an investment since the 1990s, claims inflation has not been a problem and the falling dollar has not been an issue since we buy things in dollars.

click charts courtesy of stockcharts.com to see full sized images


Cutting the Fed Funds target rate from 6.50% in January 2001 to 1.0% in June 2003 may have inflated the US stock market out of its bear market when priced in dollars but it had consequences.

This chart of the DOW Jones Industrial Average (DJIA) priced in gold shows the markets are not as healthy as one might think due to the decline of the US dollar.
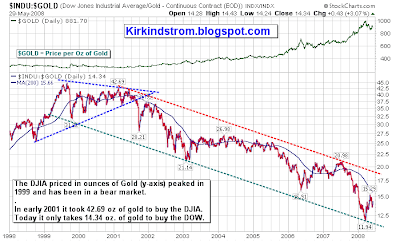
When you price the markets in a currencly like gold that reflects inflation, such as gold, the markets remain in a bear market! This may explain why the US consumer feels she is continously squeezed despite claims from Bob Brinker that inflation has not hurt the consumer.

Cutting interest rates to get the US out of a recession may have worked but the inflation in commodites and devaluation of the US dollar it caused has caused pain for the US consumer. This pain is often blamed on president Bush who took office just as the DOW/Gold ratio broke out of the "symetrical triangle" pattern. I think it also explains why a populist like Barak Obama with the most liberal voting record in the US Senate has a good chance to win the upcoming presidential election.

More on "Symetrical Triangle" chart pattern

A Great Father's Day Gift!

The Bible for technical analysis, Technical Analysis of Stock Trends, by Robert Edwards and John Magee, says about 75% of symmetrical triangles are continuation patterns and the rest mark reversals. The "return to the apex" of the Gold/DOW ratio in late 2001, early 2002 confirmed the technical breakdown of this chart pattern. For more information, read chapter eight "Important Reversal Patterns - The Triangles."

Come Join Us!

Request Invitation to FREE facebook group "Investing for the Long Term" where you can participate in the "Bob Brinker Discussion Forum.

"We email regular "FREE Bob Brinker Fan Club Updates" to everyone on our "Bob Brinker Fan Club" distribution list. If you would like to get on this list, then click this link.

Saturday, May 24, 2008

What we Are Reading

Good reading for this holiday weekend!

  • Saturday, May 24, 2008:
    "Stock Market Returns After Oil Prices Double in a Year or less"
    As of Friday's close, oil prices are up 103% in the last year. The article examines some successful predictions for higher oil prices and looks at what the people are saying today.
    .
  • May 23, 2008:
    Bob Norton's Shadow of Bob Brinker's "Five Root Causes of a Bear Market" Update
    .
  • May 24, 2008: Bill Gross Investment Outlook
    I’ll tell you another area where we’ve been foolin’ ourselves and that’s the belief that inflation is under control......I wasn’t an inflationary Paul Revere or anything, but I joined others in arguing that our CPI numbers were not reflecting reality at the checkout counter. In the ensuing four years, the debate has been joined by the press and astute authors such as Kevin Phillips whose recent Bad Money is as good a summer read detailing the state of the economy and how we got here as an "informed" American could make.
    The U.S. seems to differ from the rest of the world in how it computes its inflation rate in three primary ways: 1) 'hedonic quality' adjustments, 2) calculations of housing costs via 'owners’ equivalent rent', and 3) 'geometric weighting'/'product substitution'. The changes in all three areas have favored lower U.S. inflation and have taken place over the past 25 years, the first occurring in 1983 with the BLS decision to modify the cost of housing. It was claimed that a measure based on what an owner might get for renting his house would more accurately reflect the real world— a dubious assumption belied by the experience of the past 10 years during which the average cost of homes has appreciated at 3x the annual pace of the substituted owners’ equivalent rent (OER), and which would have raised the total CPI by approximately 1% annually if the switch had not been made.

Be safe everyone and happy Memorial Day

Wednesday, May 21, 2008

Fed Signals Rate Cuts Are Done, Lowers Growth Forecast for 2008

Today the Federal Reserve released the minutes from its last meeting. In these minutes they said cutting rates from 2.25% to 2.00% at the last meeting was a "close call" and they think future rate cuts are unlikely even if the economy contracts.

The FOMC also released their updates for GDP to rise between 0.3% to 1.2% this year. This is a reduction in their prior forecast of 1.3 to 2% GDP growth for 2008.
  • The staff projection pointed to a contraction of real GDP in the first half of 2008 followed by a modest rise in the second half of this year, aided in part by the fiscal stimulus package. The forecast showed real GDP expanding at a rate somewhat above its potential in 2009, reflecting the impetus from cumulative monetary policy easing, continued strength in net exports, a gradual lessening in financial market strains, and the waning drag from past increases in energy prices.
They also raised their forecasts for the unemployment rate, CPI or "headline inflation" and core inflation as measured the price index for personal consumption expenditures, or PCE, that Bob Brinker has discussed on his show.

For the short term, they expect inflation pressure from higher energy prices to continue:
  • The forecast of headline PCE inflation in 2008 was revised up in light of the further run-up in energy prices and somewhat higher food price inflation;
  • headline PCE inflation was expected to exceed core PCE price inflation by a considerable margin this year.
  • In view of the projected slack in resource utilization in 2009 and flattening out of oil and other commodity prices, both core and headline PCE price inflation were projected to drop back from their 2008 levels, in line with the staff's previous forecasts.
For 2010 they expect inflation as measured by the overall PCE to moderate.
  • On balance, participants expected the recent increases in oil and food prices to continue to boost overall consumer price inflation in the near term; thereafter, total inflation was projected to moderate, with all participants expecting total PCE inflation of between 1-1/2 percent and 2 percent by 2010.

From An Alternative To Bob Brinker's Inflation Outlook:

  • Bob Brinker: "We have always maintained that rising oil prices act as a tax on consumers, and are therefore counter-inflationary as they have a negative impact on consumer discretionary spending power." (No mention of core inflation)

Sunday, May 18, 2008

An Alternative To Bob Brinker's Inflation Outlook

This weekend Bob Brinker said he didn't buy into the conspiracy theories that some have which say real inflation is much higher than officially reported. This was no surprise since Brinker is on record of predicting low inflation while saying a higher price for oil is deflationary. From March Inflation Up on Higher Energy and Food Costs:
  • "We have always maintained that rising oil prices act as a tax on consumers, and are therefore counter-inflationary as they have a negative impact on consumer discretionary spending power." (No mention of core inflation)

If you want a good discussion of "the other side of the issue" then I recommend reading

Excerpts:

  • The real numbers, to most economically minded Americans, would be a face full of cold water. Based on the criteria in place a quarter century ago, today's U.S. unemployment rate is somewhere between 9 percent and 12 percent; the inflation rate is as high as 7 or even 10 percent; economic growth since the recession of 2001 has been mediocre, despite a huge surge in the wealth and incomes of the superrich, and we are falling back into recession.
    .
  • Readers should ask themselves how much angrier the electorate might be if the media, over the past five years, had been citing 8 percent unemployment (instead of 5 percent), 5 percent inflation (instead of 2 percent), and average annual growth in the 1 percent range (instead of the 3–4 percent range). We might ponder as well who profits from a low-growth U.S. economy hidden under statistical camouflage. Might it be Washington politicos and affluent elites, anxious to mislead voters, coddle the financial markets, and tamp down expensive cost-of-living increases for wages and pensions?
    .
  • Since the Consumer Price Index was calculated by tracking a bundle of prices, so-called "core" inflation would simply exclude, because of "volatility," categories that happened to be particularly troublesome: at that time, food and energy. Core inflation could then be spotlighted when the "headline" number was embarrassing, as it was in 1973 and 1974. (The economic commentator Barry Ritholtz has joked that core inflation is better called "inflation ex-inflation"— i.e., inflation after the inflation has been excluded.)
    .
  • Nothing, however, can match the tortured evolution of the third key number, the somewhat misnamed Consumer Price Index. Government economists themselves admit that the revisions during the Clinton years worked to reduce the current inflation figures by more than a percentage point, but the overall distortion has been considerably more severe. Just the 1983 manipulation, which substituted "owner equivalent rent" for home-ownership costs, served to understate or reduce inflation during the recent housing boom by 3 to 4 percentage points.

Kirk Comment: An item I see missing from CPI calculations is the decrease in quality of customer service. You may get an item 50% cheaper these days but how much do you save if you value your time and spend hours on the phone with people in other countries to get information you should not have had to ask for? It is probably not a big deal until you add up all the time you could spend on the phone disputing bills to getting help for products that don't work rather than just live with it because it is not worth the hassle.


Bad Money: Reckless Finance, Failed Politics, and the Global Crisis of American Capitalism
by Kevin Phillips (Author)

(Hardcover)


J. Lewis wrote: "I have just ordered this book, but based on the excerpt published in this month's Harper's, it is a must-read for anyone concerned about our nation's economy and our position in the world. It appears to be lucid and well written, and it is not a political screen. (The bad guys are every administration in recent memory, not just the Bushes.)

Simply put, over the past 30-40 years, various administrations have changed the statistical bases of economic analysis. If consistent standards were used, inflation and unemployment would be shown to be much higher and the GNP much lower than we believe. We are losing the economic battle, but do not understand the extent to which we are because we have succeeded in lying to ourselves."

Tuesday, May 13, 2008

Bonus Bucks Trivia Answers: CNBC Million Dollar Challenge

ForBestAdvice.com has the "Bonus Bucks" trivia answers to the daily and weekly questions asked on CNBC's "Million Dollar Stock Portfolio Challenge"

For example:

  • Squawk Box Question 5/13/08: CNBC.com Video: On May 5, analyst Elaine Kub discussed a possible commodity cartel. What commodity was it?
    .
  • Answer: Rice
Nice web site: World Market Graphs at a glance

Sunday, May 04, 2008

Correction Update for Bob Brinker Fan Club

For the S&P500, the correction from intraday high to intraday low was 20.2% and we are currently 10.3% off the peak. Details below for the S&P500, DJIA and NASDAQ markets for intraday and closing numbers.

What did you do in the correction? Did you take profits when the markets were near all time highs so you could buy on the recent market weakness?

We did and we recently bought SPY at $130.61. See:

Correction Statistics for 05/04/08

S&P 500 Chart (Using Intraday prices):

  • Last Market High 10/11/07 at 1,576.09
  • Last Market low 03/17/08 at 1,256.98
  • Current S&P500 Price 1,413.90
  • Decline in Pts 162.19
  • Decline in % 10.3%
  • Max Decline 20.2%

This means the correction from intraday high to intraday low is 20.2% and we are currently 10.3% off the peak.

The decline from the high to the low on a closing basis is 18.6%
.
DJIA Chart (Using Intraday prices):

  • Last Market High 10/11/07 at 14,279.96
    Last Market Low 01/22/08 at 11,508.74
    Current DJIA Price 13,058.20
    Decline in Pts 1221.76
    Decline in % 8.6%
    Max Decline 19.4%

This means the correction from high to low has been 19.4% and we are currently 8.6% off the peak.

The decline off the high on a closing basis has been 17.1%

NASDAQ Chart (Using Intraday prices):

  • Last Market High 10/31/07 at 2,861.51
    Last Market Low 03/17/08 at 2,155.42
    Current NASDAQ Price 2,476.99
    Decline in Pts 384.52
    Decline in % 13.4%
    Max Decline 24.7%

This means the correction from high to low has been 24.7% and we are currently 13.4% off the peak.

The decline off the high on a closing basis has been 24.1%

Subscribe NOW and get the May 2008 Issue of Kirk Lindstrom's Investment Letter for FREE! ! (more information)

Mother's Day - Support the Bob Brinker Fan Club


Buy 1 dozen multi roses get 1 dozen FREE! Plus FREE vase & Chocolates!

Buy 12 Multi Roses, get 12 FREE! Plus FREE vase & chocolates! exp. 5.8.08

Click pictures to order.

Saturday, May 03, 2008

Long Term Brinker Shadow Timing Model Update 5/1/08

We posted Bob Norton's shadow timing model update at The Bob Brinker Fan Club on May 1, 2008.

This is a Special Report by Bob Norton for the Bob Brinker Fan Club.