Sunday, November 29, 2020

Market Update 11/27/2020 - New Record Highs!

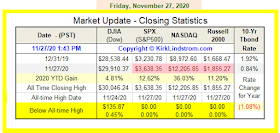
📉Market Update 11/27/2020📈💰💲 On Friday, 11/27/2020, we got new record highs for the S&P 500, the Nasdaq, the Russell 2000 small cap index and my Explore Portfolio!!! My Explore stocks are up about 28% YTD!  Details below.
📰🏆I'm also mentioned twice in the most recent issue of Timer Digest! 🏆 I'm tied for first in the 6-month category and tied for 🏆fifth place in the 2-year category!


Subscribe to my newsletter service and get the November 2020 newsletter for free!
My Explore Portfolio is a mixture of stocks, ETFs, bonds and cash

A year of "Kirk Lindstrom's Investment Service" includes
  1. SPECIAL email alerts when I buy or sell securities for my explore portfolio
  2. A list of "Auto Buy" and "Auto Sell" levels set ahead of time so you can place limit orders with your broker. 
  3. SPECIAL email alert reminders when stocks I follow reach my automatic buy and sell levels
  4. Email alerts when I make changes to these target levels. 
    • The idea is you can set "limit orders" on weekends or evenings and not worry while you work.
  5. An "online list" of my buys and sells for each security with graphs so you can check these from anywhere with any device that is connected to the internet without passwords.
  6. 12 monthly electronic (PDF) issues of "Kirk Lindstrom's Investment Letter" that contains all the information I check monthly for each of the securities I follow plus updates on key sentiment and economic factors that help me decide what to recommend
    • and
  7. Send you any back issues you want FOR FREE.


Discuss this post in my "
Investing for the Long Term" Facebook group here.
Saturday, April 11, 2020

Market Update 4/11/20 - Best Week Since 1974

Market Update 4/11/20: For the Easter holiday-shortened week, the S&P 500 surged 12.1% for its biggest one-week gain since 1974, while the Dow rallied 12% and the Nasdaq jumped 10.6%.
For the year, the Dow, S&P 500 and Nasdaq are down 16.9%, 13.7% and 9.1% respectively with the Russell 2000 still in bear territory down 25.3% YTD .


While the the Dow, S&P 500 and Nasdaq are now down less than 20% from their peaks, the Russell 2000 trails significantly at down 28.4%.

For years, Bob Brinker talked about Intel (INTC) and called it "a great trading stock." Hopefully you paid attention and learned to trade Intel around a core position. If not, you can get help from my newsletter.
I took profits in January at $66.57 then used the bear market decline to buy the shares back at a $14.65 discount ($66.57-$51.92=$14.65) in March.
Here is a copy of the email alert I sent my subscribers to REMIND them Intel reached the price I published in the newsletter for buying shares back.

More Intel charts.  The second chart has a very cool AI (Artificial Intelligence) feature that draws resistance and support lines on the one-year graph.


During the COVID-19 Bear Market Decline, I added to 15 of the 17 individual "issues" I cover in my newsletter for "Kirk's Explore Portfolio." That was a record as typically there are only one or two buys or sells during a month. I haven't worked so hard to send out alerts and update my newsletter with new target prices (listed on the full page coverage of each individual issue with a summary of all buy and sell prices updated on page 5 of each newsletter) since I started the newsletter in 1998! Order a Free Sample Issue if you wish to see what this looks like.
Now with the great, big rally from the bottom, we are very, very close to my "take profits" points for many of these stocks. Some are still closer to the buy points so it is not too late either. IF this turns out to be a long, secular bear market with cyclical bull market rallies, then I should continue to profit from that volatility.

Kirk Lindstrom's Investment Letter
Don't miss out!
 Get April Issue For Free!

Come discuss this article and more on my Facebook "Investing for the Long Term" group!

Saturday, March 14, 2020

Bear Market Update for March 13, 2020

Happy Pi Day! Market Update for Pi Day (3/14/2020):


Below these notes are a set of charts for this week's Market Update. 
  • I have a new set of charts where you can watch the markets trade during the day.  I'm also adding 1-year charts to the individual stock chart pages that have AI (Artificial Intelligence) to draw resistance and support lines.  A great example is this chart for SPY that shows a "megaphone" or "broadening" pattern.

  • Since 3/9/20 I sent eight (8) Special Alert emails 📬 to my subscribers. 
  • 📬If you subscribe and did not get these, send me an email and I'll forward them all again. 
  • 📬If you wish to subscribe now, I'm offering the March issue for free now to new subscribers PLUS all back issues and Special Alert emails sent since the last newsletter are available, just ask.
I hope you were like me and took considerable profits while the market was setting record high after record high since the 2018 Christmas Bear Market when the S&P 500 was last down over 20%.

Having raised cash, it is amazing how well I sleep at night despite the unexpected, sudden market sell-off.

Closing Statistics for the low, so far on 3/12/2020:
My Explore Portfolio, down 10.3% YTD vs the S&P 500 via SPY down 16.3%.

Subscribe NOW and get
the
March 2020 Issue for
FREE!!!

More charts showing the bear market:


Here is proof that Bitcoin is neither a currency or a store of value but just another speculation.

The great news is investors sentiment is in the tank, hence the reason I sent so many email alerts last week.


Subscribe NOW and get
the
 March 2020 Issue for 
FREE!!!

DISCLAIMER: The information contained in this newsletter is not intended to constitute financial advice, and is not a recommendation or solicitation to buy, sell or hold any security. This newsletter is strictly informational and educational and is not to be construed as any kind of financial advice, investment advice or legal advice. Copyright Kirk Lindstrom 2020.