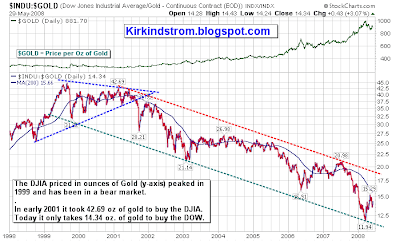
click charts courtesy of stockcharts.com to see full sized images

Cutting the Fed Funds target rate from 6.50% in January 2001 to 1.0% in June 2003 may have inflated the US stock market out of its bear market when priced in dollars but it had consequences.
This chart of the DOW Jones Industrial Average (DJIA) priced in gold shows the markets are not as healthy as one might think due to the decline of the US dollar.
 When you price the markets in a currencly like gold that reflects inflation, such as gold, the markets remain in a bear market! This may explain why the US consumer feels she is continously squeezed despite claims from Bob Brinker that inflation has not hurt the consumer.
Cutting interest rates to get the US out of a recession may have worked but the inflation in commodites and devaluation of the US dollar it caused has caused pain for the US consumer. This pain is often blamed on president Bush who took office just as the DOW/Gold ratio broke out of the "symetrical triangle" pattern. I think it also explains why a populist like Barak Obama with the most liberal voting record in the US Senate has a good chance to win the upcoming presidential election.
More on "Symetrical Triangle" chart pattern
A Great Father's Day Gift!
The Bible for technical analysis, Technical Analysis of Stock Trends, by Robert Edwards and John Magee, says about 75% of symmetrical triangles are continuation patterns and the rest mark reversals. The "return to the apex" of the Gold/DOW ratio in late 2001, early 2002 confirmed the technical breakdown of this chart pattern. For more information, read chapter eight "Important Reversal Patterns - The Triangles."
Come Join Us!
Request Invitation to FREE facebook group "Investing for the Long Term" where you can participate in the "Bob Brinker Discussion Forum.
"We email regular "FREE Bob Brinker Fan Club Updates" to everyone on our "Bob Brinker Fan Club" distribution list. If you would like to get on this list, then click this link.
