Search Bob Brinker Fan Club Blogs

Monday, May 18, 2009

Market Timer Bob Brinker Remains Bullish on Stocks

Bob Brinker said on Moneytalk last weekend twice that he expects 2009 to be a significantly positive year for the stock markets.

HURRY! Subscribe NOW and get the May 2009 Issue of "Kirk Lindstrom's Investment Newsletter" for FREE! !

Charts of US Market Indexes:
DJIA - S&P500 - NASDAQ - NYSE Composite - QQQQ - Russell 2000 - Russell 3000 - Wilshire 5000
Honeybee reported in "Bob Brinker's Moneytalk: Excerpts, Summary and Commentary, May 16, 2009" [link] the details. Excerpt:
* For the week, the Dow (Charts) declined 3.6%, closing at 8268.64
* For the week, the S&P 500 (Charts) Index declined 5%, closing at 882.88
* The Nasdaq (Charts) declined 3.4%, closing at 1680
* GOLD closed at $931.30
* OIL closed at $57

This was a down week for the market. It's worth noting that last weekend Bob Brinker said this:

"You know, I published a statement in January that I thought that 2009 could be a good year for the stock market – and that was back in January……A lot of people thought basically I had gone insane to make a comment like that. Look, it’s only May and we’re already in positive territory. Certainly we can slip back into negative territory for a period. Nobody can rule that out because we are only in minor positive territory using the S&P 500…..I still think 2009 is going to be a significant positive year for the stock market. I’m on record back in January having said that and I’m not changing anything about that forecast. I think that 2009 will be a significant up year for the stock market."
Of course Bob Brinker thought at the start of 2008 that the market would reach 1600s in 2008 and it didn't.
January 2008 Marketimer with S&P500 @ 1468.36 : Dollar Cost Average. Lump sum mid 1400's
Pg 3: “In summary, the Marketimer stock market timing model indicates that conditions are favorable for the market as we enter 2008. We expect the S&P Index to achieve new record highs this year and to reach the 1600’s range in the process. We continue to rate the market attractive for purchase on any weakness into the S&P 500 Index mid-1400’s range. Above this range we prefer a dollar-cost-average approach for new purchases. All Marketimer model portfolios remain fully invested as we enter 2008."
I don't see how anyone who was 100% invested and so bullish at the top could think he can time the stock market after missing a 57% bear market decline THEN becoming more bearish at the very bottom.

I hope the bears are wrong, but the market had rallied back to its 200-day-moving-average (DMA) when Brinker started to brag again about being bullish. This 200-dma is where Bob Brinker got wildly bullish last year (green circle on the graph below) as he claimed victory and bashed the Cassandras. (See => 5/31/08: Cassandra Bashing)

I'd think he would be embarrassed that he took the DCA and gift horse buy OFF just days before the market bottomed at 676 and only got bullish for "buy on weakness" after a significant recovery.

Click chart courtesy of stockcharts.com for full size image

Brinker's Advice Summary for January 2008 until now:

  • Mid 1400 he called it a "gift horse buying opportunity"
  • Market rallies back to 1400s in 2008 and he bashes the Cassandras
  • Market bottoms in 2009 at 676 and he has no buy or advice to DCA in his newsletter just days before.
  • Market rallies significantly and he is a buyer on "weakness"
Bob Brinker was more bullish above 1400 than in the 600s to 800s.

What sort of "market timing" is that?

I really appreciate how Bob Brinker teaches his audience to ask questions and know what they buy to become their own financial advisor. But this idea he can time the stock markets goes against the books on his recommended reading list and his own lack of success proves just how difficult, if not impossible market timing is.

Recommended Newsletters


HURRY! Subscribe NOW and get the May 2009 Issue of "Kirk Lindstrom's Investment Newsletter" for FREE! !

Doubled Money in a Down Market!

Since 12/31/98 "Kirk's Newsletter Explore Portfolio" is UP 104% (over a double!) vs. the S&P500 DOWN 16% vs. NASDAQ down 22% vs. Warren Buffett's Berkshire Hathaway (BRKA) up 33% (All through 4/30/09)

As of April 30, 2009, "Kirk's Newsletter Explore Portfolio" is up 5.2% YTD vs. DJIA DOWN 6.9% vs. S&P500 DOWN 2.5%.
(More Info & FREE Sample Issue)

Friday, May 15, 2009

Robert Prechter vs Bob Brinker; Who is the Cassandra and Who is a Prophet?

Bob Brinker is bullish, is 100% invested in equities and recommends using "periods of weakness" to get to 100% equities. Robert Prechter, who unlike Brinker correctly called the 1987 bear market, continues to recommend US Treasuries and "cash like" securities because he thinks this is a bear market rally before the market rolls over to new lows, perhaps as low as 50% below the recent S&P500 low of 676!
Dow 8,284.41
Nasdaq 1,687.10
S&P500 884.89
Markets at a glance
About a year ago Bob Brinker called people like me and Robert Prechter Cassandras when the S&P500 rallied to its 200 day moving average (at about 1440 on the graph below.) Us Cassandras warned of trouble ahead for the economy. Bob Brinker , who could not have been any more wrong, thought the market was on its way to new highs for 2008 after he issued a "gift horse buy" in the mid 1400s!
Last year, Bob Brinker advised using weakness below "mid 1400s" as a "gift horse buying opportunity" to get his subscribers 100% in equities if they were not already there per his newsletter advice.

Last weekend Bob Brinker made it very clear to his audience he recommends "buying on weakness" and he expects large gains for 2009. I hope this is not another sign of a top after the market touched its 200 day moving average like it did a year ago when he bashed us Cassandras.

Click chart courtesy of stockcharts.com for full size image

Robert Prechter continued to warn that the stock market was headed lower.

It turns out Prechter was the profit last year while Brinker has egg on his face.

Unlike Bob Brinker and Prechter, I don't pretend to be able to time the market (for more than a few percent of my assets in my explore portfolio) so I took profits to get back to my target asset allocation of 70% equities after using market weakness to add to positions.

From "Robert Prechter Predicts Deflation, Depression and New Market Lows," Prechter said:
  • "Our models are (showing) right now that it is a much bigger bear market than most people realize, something along the lines of 1929-1932"

  • "I think the next leg down will be at least as severe if not more severe than what we just experienced. So you want to stay on the side of safety"
In his 2002 book "Conquer the Crash," Prechter warned of a debt bubble with deflationary depression while recommending US Treasuries. Today he still likes US Treasuries. (See US Treasury Rates at at Glance.)

Who is the Cassandra and who is a prophet this time?
HURRY! Subscribe NOW and get the May 2009 Issue of "Kirk Lindstrom's Investment Newsletter" for FREE! !


Doubled Money in a Down Market!

Since 12/31/98 "Kirk's Newsletter Explore Portfolio" is UP 104% (over a double!) vs. the S&P500 DOWN 16% vs. NASDAQ down 22% vs. Warren Buffett's Berkshire Hathaway (BRKA) up 33% (All through 4/30/09)

As of April 30, 2009, "Kirk's Newsletter Explore Portfolio" is up 5.2% YTD vs. DJIA DOWN 6.9% vs. S&P500 DOWN 2.5%.
(More Info & FREE Sample Issue)


Conquer the Crash: You Can Survive and Prosper in a Deflationary Depression
(Hardcover w/ Updates for 2009)

by Robert R. Prechter Jr (Author), Robert R Prechter Jr (Editor)

Price: $27.95 & this item ships for FREE with Super Saver Shipping


More Info:

  • US Treasury Rates at a Glance

  • May 14 Reuters interview

  • ~1995 Barron's Interview
    From: da_cheif™ 7/12/2005 9:04:36 PM
    prechter was interviewed by barrons about 10 years ago...when the dow was at 3500.....he sed that if the dow ever went about 4000 it would prove he didnt know what he was talking about and that nobody should pay attention to him again......lolol.....thats why the recognition wave is still ahead.....it will make the 90s look like childs play....snort

  • LIBOR Rates at a Glance

Monday, May 11, 2009

The Future of Microsoft, The Future of Technology

This May 6, 2009 video from the Stanford University lecture series "Entrepreneurial Thought Leader Lecture" is a must watch for all fans of Microsoft (MSFT Charts) and technology stocks in general.

In the video, Steve Ballmer, Microsoft CEO, shares his optimism for emerging innovation in the midst of economic turmoil, and the story of his own entrepreneurial path. He also speaks of his company's continued investment in Internet-ready hardware and software that seeks progress in healthcare, education, and science. The Q&A session at the end is also very good.

The Future of Microsoft, The Future of Technology
===============================================
===============================================

Bob Brinker currently has Microsoft (MSFT Charts) as a "hold" in his newsletter. Before that, he had it as a "BUY at $23" in May 2003, six years ago. I don't remember when he switched from "BUY" to "HOLD" but it is odd he liked it more at a higher price.


2009 Year-To-Date (through April 30, 2009)
"Kirk's Newsletter Explore Portfolio" is UP 5.2% vs. S&P500 DOWN 2.5%

HURRY! Subscribe NOW and get the May 2009 Issue for FREE! !
(Your 1 year, 12 issue subscription will start with next month's issue.)


Sunday, May 10, 2009

Best Investment Newsletter

2009 Year-To-Date (through April 30, 2009)
"Kirk's Newsletter Explore Portfolio" is UP 5.2% vs. S&P500 DOWN 2.5%
HURRY! Subscribe NOW and get the May 2009 Issue for FREE! !
(Your 1 year, 12 issue subscription will start with next month's issue.)

Message to Bob Brinker Fans:

Did your current investment newsletter tell you to raise cash by taking profits near the market top in 2007?

Mine did! I took profits to increase the cash position of my most aggressive "explore portfolio" to 30%.
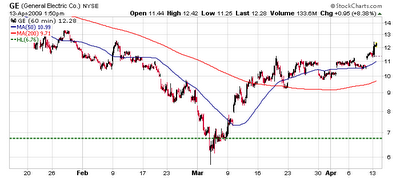
Did your current investment newsletter tell you to use cash raised when the markets were near their highs to buy a blue chip DOW stock when the markets were at their lowest levels in 13 years?

Mine did! When the markets made a 13 year low, I had cash in the portfolio and told my subscribers to use some of it to buy some General Electric (GE Charts) shares at $6.76.
Click to view full size GE chart courtesy of stockcharts.com

HURRY! Subscribe NOW and get the April 2009 Issue of "Kirk Lindstrom's Investment Newsletter" for FREE! !

Did your current investment newsletter tell you to use cash raised from when the markets were near their highs to buy a speculative, very high growth telecom growth stock when the markets were at their lowest levels in 13 years and that telecom stock was making an all time low?

Mine did! I had cash in the portfolio and told my subscribers to use it to buy some some Finisar (FNSR Charts) shares at $0.24. Today Finisar (at $0.72) is up triple since my buy alert near the bottom of the bear market.
Click to view full size chart courtesy of stockcharts.com

Since 12/31/98 "Kirk's Newsletter Explore Portfolio" is UP 104% vs. S&P500 DOWN 16% vs. NASDAQ down 22% vs. Warren Buffett's Berkshire Hathaway (BRKA) up 33% (All through 04/30/09) (More Info)

2009 YTD
"Kirk's Newsletter Explore Portfolio" is
UP 5.2% vs. S&P500 DOWN 2.6%

HURRY! Subscribe NOW and get the May 2009 Issue for FREE! !
(Your 1 year, 12 issue subscription will start with next month's issue.)

Friday, May 01, 2009

4% CD Rates at Pentagon Federal Credit Union

4% CD Rates at PenFedCU Pentagon Federal Credit Union

PenFed CU, or Pentagon Federal Credit Union, is paying 4.0% on five and seven year NCUA insured certificates of deposit.

At a time the 1-year US Treasury note is only paying 0.47%, PenFed is paying nearly four times that for certificates with a 1-year term.

==> " Pentagon Federal Money Market Certificates " <==
as of 5/1/09

Term   APY

6-Month 1.75%
1-Year 2.00%
2-Year 2.25%
3-Year 3.50%
4-Year 3.75%
5-Year 4.00%
7-Year 4.00%
More information at Pentagon Federal Credit Union

For more rates and terms, see
Congress has temporarily increased NCUA share insurance from $100,000 to $250,000 per depositor through December 31, 2009.

Your Pentagon Federal Credit Union deposits are insured to at least $250,000 and backed by the full faith and credit of the United States government. National Credit Union Administration, a U.S. Government agency. We do business in accordance with the Federal Fair Housing Law and the Equal Credit Opportunity Act.

New I-Bond Rates; New iBond Composite Rates

The Bureau of the Public Debt today announced an earnings rate of 0.00% for Series I Savings Bonds issued from May through October 2009. Earnings rates (also know as the composite rates) for I bonds are set each May 1 and November 1. Interest accrues monthly and compounds semiannually. Bonds held less than five years are subject to a three-month interest penalty. I Bonds have an interest-bearing life of 30 years.

I Bond Earnings Rate 0.00%, Fixed Rate 0.10%

For more information, see:
The earnings rate for Series I Savings Bonds is a combination of a fixed rate, which applies for the life of the bond, and the semiannual inflation rate.

The 0.00% earnings rate for I bonds bought from May through October 2009 will apply for their first six months after issue. The earnings rate combines a 0.10% fixed rate of return with the -5.56% annualized rate of inflation as measured by the Consumer Price Index for all Urban Consumers (CPI-U). When the inflation rate is less than zero, a bond's earnings rate is less than its fixed rate (but the earnings rate is never less than zero).

The fixed rate applies for the 30-year life of I bonds purchased during this six-month period.

The CPI-U decreased from 218.783 to 212.709 from September 2008 through March 2009, a six-month change of -2.78%.

For older ibonds and what they will pay, see:


FREE Updates Mailing List


We email regular "FREE Bob Brinker Fan Club Updates" to everyone on our "Bob Brinker Fan Club" distribution list. If you would like to get on this list, then click this link.


Top Rated Newsletter


Timer Digest Features
Kirk Lindstrom's Investment Letter
on its Cover

Cick to read the full page article!


US Treasury Rates at a Glance - iBond Rates - LIBOR Rates

Must Read:
Beware of Annuities - Payday Loans Warning