Tuesday, December 28, 2010

Bob Brinker S&P500 Targets for 2011

What does Bob Brinker have in common with David Kostin, Barry Knapp, Dan Chung, Richard Bernstein, David Bianco, Abby Joseph Cohen, and Bob Doll?

The answer is they are all bullish as 2010 ends and we enter 2011 but Bob Brinker is the least bullish of these experts.

Honeybee reported on Sunday (Dec. 26, 2010) Bob Brinker's current market outlook:
Bob Brinker's latest stock market views:
  • Brinker is bullish on the stock market, his portfolios are fully invested and his S&P 500 Index target range for 2011 is: Marketimer, December 3, 2010, Bob Brinker said: "....we project a target range in the low-to-mid 1300's for the S&P 500 Index as we move forward in 2011."
With the S&P500 currently at 1,258.51 (Quote and chart), low 1300s is not much of a reach.  Others are going more out on a limb with predictions of mid 1400s to 1500!

In the comments section of the same article, sivbum summarized the targets for other gurus:
  • Besides BB's bullish call, there are a bunch more:
    • David Kostin, Goldman Sachs, target is 1450.
    • Barry Knapp, Barclay’s (BCS) has a 1420 year end target.
    • Dan Chung, Alger Funds, hit 1500-plus at some point in the S&P 500 next year.
    • Richard Bernstein expects about a 15% rise on the S&P 500 in the next 12 months.
    • David Bianco, Bank of America Merrill Lynch, has about 15% in total returns.
    • Abby Joseph Cohen, Goldman Sachs,12-month market forecast for the S&P is 1450.
    •  Bob Doll, Black Rock, double digit returns, including dividends.
You have to take what they say with a grain of salt, Honeybee also reported:
Interesting to compare what Brinker was saying three years ago before the market dropped over 57%:
  • January 4, 2008 Marketimer, Page 3; Paragraph 1; (S&P 1468.36), Bob Brinker said: "In summary....conditions are favorable for the market as we enter 2008. We expect the S&P 500 Index to achieve new record highs this year and to reach the 1600's range in the process. We continue to rate the market attractive for purchase on any weakness into the S&P 500 index mid-1400's range. Above that range we prefer a dollar-cost- average approach for new purchases. All Marketimer Model Portfolios remain fully invested as we enter 2008......And I believe those new all-time-historic-record highs will develop as we move into 2009."
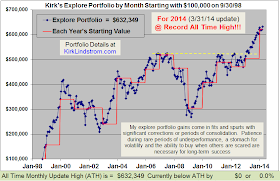
 Since 12/31/98 "Kirk's Newsletter Explore Portfolio" is UP 213%  vs. the S&P500 UP only 25% vs. NASDAQ  UP a only 22%   (All through 12/27/10)

In 2009, "Kirk's Newsletter Explore Portfolio" gained 33.5% vs. the DJIA up 18.8%

2010 YTD my "Explore Portfolio" is up 20.7% YTD
(the explore portfolio has 70% in equities and 30% in fixed income so the stocks are doing very, very well)

Today's market closing numbers:
Dow11,575.54+20.51+0.18%
Nasdaq2,662.88-4.39-0.16%

S&P 5001,258.51+0.97+0.08%

10 Yr Bond(%)3.4810%+0.1300

Oil91.25+0.25+0.27%

Gold1,405.90+23.50+1.70%

Returns for last 12 years:  2010 YTD through 12/15/10

:
Click for Full Size Table
 Subscribe Now

Monday, December 20, 2010

Bob Brinker's Top Book Recommendation

Bob Brinker's "One Book to read over the holidays"
This weekend Bob Brinker said that if he had to pick one book to recommend reading from all the guests he had on the show this year it would be Andrew Sorkin's book Too Big to Fail: The Inside Story of How Wall Street and Washington Fought to Save the FinancialSystem--and Themselves

Brinker said Sorkin's book provides a comprehensive view of what happened to the financial system in the meltdown and the players involved.

Product Description:
A brilliantly reported true-life thriller that goes behind the scenes of the financial crisis on Wall Street and in Washington.

"In one of the most gripping financial narratives in decades, Andrew Ross Sorkin-a New York Times columnist and one of the country's most respected financial reporters-delivers the first definitive blow- by-blow account of the epochal economic crisis that brought the world to the brink. Through unprecedented access to the players involved, he re-creates all the drama and turmoil of these turbulent days, revealing never-before-disclosed details and recounting how, motivated as often by ego and greed as by fear and self-preservation, the most powerful men and women in finance and politics decided the fate of the world's economy."
Later in the show, Bob had on the show  Barbara Weltman editor of the J K Lasser tax guides:
One caller to Sunday's show said the middle class continues to fall behind, losing ground to the rich. He said the rich are getting richer. In response to the caller, Bob Brinker said high income people should be thrilled with the bill. At the start of the show Brinker sounded pleased when he reported that the new tax law was finally enacted for the next two years. Brinker's one complaint for the new tax bill was saying he didn't think capital gains should be taxed at all.

Monday, December 13, 2010

Bob Brinker's Vanguard GNMA Fund (VFIIX) Advice

Vanguard GNMA + Cash Reserves Advice
Vanguard's web site says their GNMA fund (VFIIX quote & Charts) will go "ex dividend" on Dec. 29 with a 23¢ payout. If you are using "Bob Brinker's GNMA Advice to use a Stop Loss" to protect yourself from high net asset value loss, then you should reduce your stop price to account for this distribution.


As many regular readers if this blog know, I sold my GNMA fund awhile ago and bought TIPS and iBonds. I also sold all my bond funds not indexed to inflation. I put the remainder of my "fixed income money" in short term savings accounts that earn 1% or more. I have no reason to take bond fund risk until the Federal Reserve "normalizes" interest rates.

Some people need the income but I tell my subscribers there is a better alternative. I recommend selling SOME of your appreciated stocks or funds when you do your annual rebalance then use some of the profit taking cash for spending over the next year. Put the money into a savings account to use during the year to replace the income from bond interest and dividends. My explore portfolio is up 17.9% YTD so I've already taken significant profits.

I currently have the bulk of my fixed income cash at HSBC Bank and StarOne Credit Union. They both just dropped rates so I am leaning towards moving some of the money to American Express for 1.30%. For details, click "Learn More" here. If you hear of a large bank paying a better rate for short term savings, send me an email with the details.

Fixed Income Advice

This is what I sent my newsletter subscribers earlier today:
Hello Subscribers

I moved my explore portfolio cash reserves from Schwab, where I was earning 0.25%, to American Express Bank where they are paying 1.30% APY.

If you have significant funds in a retirement account at Vanguard's prime money fund and don't want to move to another institution, then  I suggest making a ladder of CDs with Vanguard's CD Ladder tool.  Divide the funds into 5 buckets. Keep 1 bucket (20%) in Prime money fund ready for any buying opportunities or potential rebalancing, then put the remaining 80% into CDs for 3, 6, 9 and 12 months.  As the 3,6 and 9 month CDs mature, buy a new 1-YR CD.  After 9 months, you will have four one year CDs with one maturing every quarter.  When interest rates normalize, you can put the CD funds into the total bond fund again.

You can get an idea what different banks are paying for CDs and savings accounts for various amounts by using the rate tool here.  I use American Express because it is available to everyone and it is "too big to fail."  You can often find better deals with more restrictions such as the 1.3% at Capital One plus 10% bonus and up to $60 credit detailed here, but you have to be a member of Costco.

For reporting simplicity, I have enough to calculate already, I will keep my core portfolios fixed income in Vanguard's prime money fund knowing it is a slight drag on my reported performance compared to the above CD ladder strategy.
The difference between 1.30% at American Express and 0.06% at Vanguard is $1,240 per $100,000.  Thus it is worth the trouble if you have significant money in fixed income you don't want exposed to rising rates in the bond market.

2010 YTD my "Explore Portfolio" is up 18.7% YTD
(My explore portfolio has 70% in equities and 30% in fixed income so the stocks are doing very, very well)
Subscribe NOW  
and get the This Month's Issue for FREE! !
Your 1 year, 12 issue subscription will start with next month's issue.

Since 12/31/98 "Kirk's Newsletter Explore Portfolio" is UP 208%  vs. the S&P500 UP only 23% vs. NASDAQ  UP a only 20%   (All through 12/13/10)  

In 2009, "Kirk's Newsletter Explore Portfolio" gained 33.5% vs. the DJIA up 18.8%

Wednesday, December 08, 2010

Dancing Bob Brinker

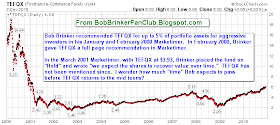
For anyone still holding TEFQX or QQQ per Bob Brinker's advice to purchase these securities in 2000 before the market melted down, this one is for you.


Personalize funny videos and birthday eCards at JibJab!

Bob Brinker's dancing is similar to his advice. He gave aggressive "off the books" advice to buy QQQQ and TEFQX back in 2000 that worked out poorly. Clients in his money management company, the BJ Group, had no choice and all portfolios were put into the NASDAQ100 before it crashed. Brinker likes to advertise his "model portfolio" results that stayed mostly in cash but we know better. Brinker has "danced" around questions about this advice ever since.

=> Bob Brinker's QQQ Advice
  • We recommend Marketimer subscribers with aggressive objectives invest 30% to 50% of existing CASH RESERVES in QQQ shares in order to exploit this opportunity.
  • Also we recommend subscribers with conservative objectives invest 20% to 30% of CASH RESERVES in the QQQ shares in order to take advantage of this opportunity.
=> Bob Brinker's TEFQX Advice
  • Brinker, Feb 8, 2000 MT: TEFQX=$15.99; "Firsthand e-Commerce Fund is the newest addition to the Marketimer No-Load Fund Recommended List on Page four...... We have ALWAYS viewed books, toys and on-line auctions as the tip of the iceberg for electronic business. We believe business-to-business transactions will greatly surpass retail e-commerce including software development tools, database providers, hardware manufacturers and service providers.

    We are very positive on the potential for the internet growth track to carry forward through international penetration. We are hopeful the fund will be able to add many of the best positioned B2B companies going forward. Many of these companies are not yet publicly owned but will come to market in the future."
TEFQX Chart:
QQQ Chart
More QQQQ Charts


Learn the "Core and Explore" approach to investing
with "Kirk Lindstrom's Investment Letter"


Wednesday, December 01, 2010

Key Reading For December

December Reading:
Bob Brinker's Moneytalk Show Summaries for
  • November 14, 2010 Show Summary, Excerpts and Commentary
    • Honeybee: Brinker is bullish on the stock market and has remained fully invested since March 2003. For new stock market money he recommends dollar-cost-averaging at the present time. His current S&P target range is 1300 - 1350.
  • November 7, 2010 Show Summary, Excerpts and Commentary
    • Now of course the way to take advantage of a market like this is to be fully invested. That is the posture we have taken.

Friday, November 05, 2010

Cost of Fannie Mae and Freddie Mac Bailouts

Cost of Fannie, Freddie bailout might hit $685B.
Initially projected two years ago to cost taxpayers $200B, the bailout of Fannie Mae (FNMA.OB) and Freddie Mac (FMCC.OB) could reach $685B, according to a new S&P estimate.
Fannie and Freddie have already cost taxpayers nearly $134 billion, but S&P analysts said Thursday that the government could ultimately be forced to inject $280 billion into the firms because of a slowdown in the housing market.
Creating the companies to take the place of the two fallen mortgage giants will likely cost taxpayers another $400B in capital. S&P analysts wrote that addressing the firms' problems "is likely to be an expensive repair job for U.S. taxpayers."
Since 12/31/98 "Kirk's Newsletter Explore Portfolio" is UP 187% (a double plus another 87%!!) vs. the S&P500 UP only 21% vs. NASDAQ  UP a only 18%   (All through 11/4/10) 
In 2009, "Kirk's Newsletter Explore Portfolio" gained 33.5% vs. the DJIA up 18.8%
2010 YTD the "Explore Portfolio" is up 10.5% YTD
  • Subscribe NOW and get the November 2010 Issue for FREE!   
  • Your 1 year, 12 issue subscription will start with next month's issue.
Full WSJ Story:  Fannie, Freddie Overhaul Could Cost $685 Billion

Saturday, October 16, 2010

No Social Security COLA for 2011


The Social Security Administration announced "There will be no increase in Social Security benefits payable in January 2011, nor will there be an increase in SSI payments."  Press Release
COLA Computation
  • The last year in which a COLA became effective was 2008. Therefore the law requires that we use the average CPI-W for the third quarter of 2008 as the base from which we measure the increase (if any) in the average CPI-W. The base average is 215.495, as shown in the table below.
  • Also shown in the table below, the average CPI-W for the third quarter of 2010 is 214.136. Because there is no increase in the CPI-W from the third quarter of 2008 through the third quarter of 2010, there is no COLA for December 2010.
CPI-W for—
2008 2010
July 216.304 213.898
August 215.247 214.205
September 214.935 214.306
Third quarter total 646.486 642.409
Average (rounded to the nearest 0.001) 215.495 214.136
Remember that the price of oil peaked during the three months in 2008 (See chart below) when the COLA for 2009 was set at 5.8%. With oil prices the past three months about half their peak value, CPI is slowly catching up but still below the 2008 calculation. The good news for seniors is they benefited from a higher SS payment than they would have received if the 2009 COLA was set a few months later after the price of oil crashed to $35 at the end of 2008.


Since this blow-up of CPI in 2008 due to high oil prices, I've reported CPI by month in my newsletter in a table so you can see what to expect. CPI peaked in July 2008 at 219.964. I show this value in Red. This September the CPI recovered to 218.439, still slightly below its 2008 peak. CPI for 2008 was only up 0.1% but Social Security beneficiaries got a 5.8% adjustment because of the spike in oil prices. They were very, very lucky to get a 5.8% raise while the rest of the country got fewer hours or lost jobs during the recession.
This table Automatic Social Security Cost-Of-Living Adjustments by Year clearly shows the January 2009 adjustment of 5.8% was the largest since July 1982!
Since actual CPI was effectively lower than what Social Security recipients were getting paid for, taxpayers were very generous to retired people at a very good time... during this recession. My guess is the CPI will make a new high in the next few months and COLAs will show up again next year for 2012.
Here is another chart showing oil prices vs the S&P500.
click image to see a larger version

Current Oil Prices and New Graph
Click for a chart and current quote for crude oil prices.

Social Security COLA Press Release

Since 12/31/98 "Kirk's Newsletter Explore Portfolio" is UP 179% (a double plus another 79%!!) vs. the S&P500 UP a small 16.2% vs. NASDAQ  UP a tiny 12.6%   (All through 10/16/10)   FREE SAMPLE

In 2009, "Kirk's Newsletter Explore Portfolio" gained 33.5% vs. the DJIA up 18.8%
2010 YTD the "Explore Portfolio" is up 7.6% YTD


Subscribe NOW and get the October 2010 Issue for FREE!  
Your 1 year, 12 issue subscription will start with next month's issue.
.

Thursday, October 07, 2010

Fixed Income - Bond Fund Risks

Here is a good article from Vanguard titled Risk lurks in the search for current income.
Key Points:
  • If someone moves from a money market fund yielding 0.11% into a bond fund yielding 2.52%, he or she would pick up 2.41 percentage points in current yield. On a $10,000 investment, that equates to $241 a year, assuming interest rates remain steady.

    But....

  • If rates were to increase by, say, 4 percentage points to 6.52%, the impact to a bond fund with an average duration of 4.3 years means the share price would drop by 17.2% (for a total drop in account balance of $1,720 on the $10,000 investment), all else equal.
In my own account and in "Kirk Lindstrom's Investment Letter" portfolios, I am totally out of bonds and bond funds not indexed to inflation.  I own and recommend TIPS, TIPS funds, Series-I Bonds, CDs with FDIC and CASH in money funds and other savings accounts.   American Express Bank is offering 1.30% and I've seen higher with a bonus at CapitalOne Bank through Costco.

In 2009 Vanguard's TIPS fund, VIPSX, gained 10.8%
In 2009 Vanguard's GNMA fund, VFIIX, gained 5.3%
As of yesterday (10/6/10)
VIPSX is up 9.05% YTD
VFIIX is up 7.08% YTD

I dumped my Vanguard GNMA (VFIIX) fund almost 2 yrs ago in my Vanguard ROTH and bought the TIPS fund VIPSX. Total gain as of yesterday  for VIPSX was 22.5%!

The REIT index fund at Vanguard, part of my core portfolios recommended for conservative and aggressive investors, is up 22.55% YTD!  It gained 29.6% in 2009 but lost 38% in 2008 so it is volatile.


Also make sure you read Vanguard Lowers Admiral Shares Minimum to $10,000

Key points:
  • Vanguard has reduced the minimum amount required to qualify for Admiral™ Shares to $10,000 for most of our broad-market index funds and $50,000 for actively managed funds, down from the previous $100,000 minimum.
  • Admiral Shares cost significantly less than traditional fund shares, and their expense ratios are among the lowest in the mutual fund marketplace.
Now all my core portfolio funds will have even better returns!

Since 12/31/98 "Kirk's Newsletter Explore Portfolio" is UP 171% (a double plus another 71%!!) vs. the S&P500 UP a tiny 14.5% vs. NASDAQ UP a tiny 8.7% (All through 10/7/10) (More info - FREE Sample Issue)

Subscribe NOW and get the October 2010 Issue of "Kirk Lindstrom's Investment Letter" for FREE!
(Your 1 year, 12 issue subscription will start with next month's issue.)

    Saturday, September 18, 2010

    Elaine Garzarelli Bullish - 1300 S&P500 Target

    Elaine Garzarelli, President, Garzarelli Capital was the Friday Market Monitor guest on "Nightly Business Report."

    Elaine was quite bullish with an S&P500 target of 1300 based on 2011 earnings. Below are excerpts from her interview with PBS host Tom Hudson.

    HUDSON: In February, you were saying the winter swoon was over and we did see prices climb through April and since then we`ve seen some volatility. What makes you think that higher stock prices are coming?

    "GARZARELLI: Well, we`ve been in a trading range for five or six months. Usually after the initial surge in a new bull market -- the market went up 70 percent for the S&P 500 after a recession -- the usual case is that the stock market goes into a trading range for six to 12 months. So that is normal. And every time that happens, there is talk about double dips. And I don`t see a double dip, therefore I think we`re going to come out of this trading range, which has been 1050 to 1150 for five or six months.

    HUDSON: OK. So how high and how fast do you think this rally could come?

    GARZARELLI: Well, my indicators have gone up from 67 percent to 82 percent which is quite bullish. The 100 percent is the maximum, so 82 percent is fairly good. Thirty percent would be a new bear market. I have earnings for 2011 at 86. The consensus now is at 95. So I`m way below the consensus and with the P/E normal of about 15, that gets us to 1300 on the S&P 500. What`s that, 15 percent?"

    HUDSON: A very bullish move, yeah.

    GARZARELLI: That is only based on `11, not based on 2012 earnings.

    HUDSON: Now you were here back in February as I mentioned and at the time, you were looking for dividend plays, including a couple of high-yield junk bond ETFs, which are up about 2 percent and that does not include any dividends. Do you still like this area?

    GARZARELLI: Absolutely. I love junk bonds.

    Garzarelli recommended the Industrial Select Sector SPDR XLI, the Home builder SPDR XHB and the Technology Select Sector SPDR XLK.

    HUDSON: Would you rather buy the XHB than a new home?

    GARZARELLI: Yes.

    HUDSON: OK, any disclosures for these funds?

    GARZARELLI: I own everything I`ve mentioned tonight in my sector analysis fund.


    IndexSept 17, 2010YTD %
    DJIA10,607.851.7
    Nasdaq2,315.612.0
    S&P 5001,125.590.9
     YTD does not include dividends.

    Saturday, September 04, 2010

    Bob Brinker Muni, GO and Bond Fund Advice

    Many callers have asked Bob Brinker about the potential to lose money in bond funds when interest rates "normalize" from historically low rates. For example, on April 5, 2010 the 10-year US Treasury Bond had a yield of 3.99%. (move the cursor over the chart here for TNX to April 5 to see the rate quoted as a "price").   Much of this year's gains in bonds are due to the yield falling to 2.70% as investors have fled stocks while pouring money into bond funds.  See:
    Brinker says if you hold a bond fund the simple thing to do is use a mental stop loss as I explain in the article Bob Brinker's GNMA Advice.
    Brinker also points out another way to avoid losing money is to buy bonds directly and hold them to maturity. If you buy US Treasuries or GNMAs directly, then you are guaranteed to get your interest payments plus principle back since the government can borrow money from the Federal Reserve which will turn on the printing press if there are not enough interested in the low rates.
    If you own municipal bond funds to lower your taxes, then Brinker says you can buy tax exempt Municipal Bonds directly from your broker. Buy NEW ISSUES to get the lowest fees. If you were worried about the quality of municipal bonds, then Brinker says you could purchase high quality state general obligations (GO Bonds) which have had no failures in over a century.  (As a Californian, I find little relief in that fact given the circus we have in Sacramento giving huge raises and pension benefits to unions that support the people in government that keep spending while the state circles the drain of insolvency.  End of digression.)

    My Warning: You need to be careful with Muni bonds because some cities, struggling with the recession, have missed payments and could default. Harrisburg, the capital of of Pennsylvania, is the latest to miss a payment and potentially default.
    Pennsylvania capital, Harrisburg, skips payment, may move closer to bankruptcy
    Harrisburg Mayor Linda D. Thompson has adamantly opposed declaring bankruptcy, while the move has been been advocated by the city controller and a growing bloc on the City Council. 
    and
    The city's bond insurance company is expected to cover its upcoming $3.3 million bond payment. But some analysts say relying on that backstop could add to the mounting pressure on firms that provide insurance for the $2.8 trillion municipal bond market.
    The good news for investors is the insurance company will make the payments but if enough cities and states like California (even with with insurance) miss payments, it could get nasty.
    Seeking Yield for Income Is Risky 
    Currently, if you need yield, it means you are taking significant interest rate risk.  Buying bonds directly is fine if your goal is to not lose money but if there is high inflation, then you will lose purchasing power to inflation whereas someone in money funds, TIPS, Ibonds or savings accounts will do much better since we will get higher returns as rates normalize (go up.)  Everyone should be aware that the Federal Reserve is again buying US Treasuries to help keep rates low and nudge investors to take more risk to help the economy grow again.  Rates could surge again when (not if) the Fed stops buying US Treasuries.

    Vanguard's GNMA fund, VFIIX, currently has an average duration of 1.7%.  That means if interest rates were to jump 1% overnight, you could expect VFIIX to lose 1.7% in net asset value, NAV.  If they jump 3%, expect NAV to fall by 5.1%, 3 times 1.7%.
    I am lucky. I have enough cash flow from my Two Investment Letters, people clicking ads on my blogs and websites plus commissions for products I recommend that I don't need yield to live on.  Thus, I take very little interest rate risk.  I've sold all my bonds and bond funds not indexed to inflation with my own money and in  "Kirk Lindstrom's Investment Letter." 

    My personal iBond portfolio currently yields 5.43% (Majority are from Oct. 2001) but of course, I only get the interest at maturity, a great way to defer taxes.  The TIPS fund I got for my Vanguard ROTH by selling the GNMA fund is up 18.4% in under 2 years.  I also hold individual TIPS and a significant holding in the TIPS fund at Fidelity, FINPX, that is up 25.8%.  I suspect those TIPS funds will give back some when rates normalize, but rates probably won't normalize without a significant inflation component so I expect they will do better than bond funds not indexed to inflation.

    Many of the stocks in "Kirk's Newsletter Explore Portfolio" are paying a great dividend while selling at very low price to earnings multiples.  My portfolios are up significantly over the past 10 years while the index funds are down.   I expect equities to significantly out perform bonds and probably CDs over the next decade and my "core plus explore" portfolio approach should do even better.
    and get the October 2010 Issue for FREE!!
    For details on both my newsletters, read

    Tuesday, August 24, 2010

    Bull vs Bear Case - Neener vs Kass & Brinker

    Bob Brinker remains bullish.  Honeybee reported Sunday:
    Brinker has been forecasting sizable gains in the S&P for 2010 and the winter of 2011. Back in the March, 2010 issue, Brinker said: "Our 2010 target range for the S&P 500 Index remains in the 1200 to 1260 zone." In May, Brinker raised that to "upper-1200's to low-1300's." He nailed the numbers down a bit more in June and July, forecasting the S&P would reach "the 1275 to 1325 range by next winter."
    From today's close of 1051.87, Brinker's 1275 to 1325 estimate for the S&P500 means he is predicting a gain of between 21% and 26%!!!

    Charles Neener Predicts DOW 5,000
    Charles Neener, former Goldman Sachs technical analyst, was on CNBC today talking about his market advice to avoid stocks and buy bonds.
    At the same time...
    Doug Kass is bullish. In BTIG Fed Model With VIX Risk Adjustment Kass says
    What is extremely noteworthy about this metric in the current environment is that the level of equity undervaluation relative to Treasuries today using this model is equivalent to the extreme levels registered in early March of last year.
    BTIG Fed Model
    Last weekend Bob Brinker said he remains in the bull camp. Of course, Brinker has been fully invested since March 2003. Two guys who correctly called the recent bear market, Kaas and Neener, now disagree on market direction.
    We believe what is happening today is the flip side of what happened in 2000. Just as investors were too enthusiastic then about the growth prospects in the economy, many investors today are far too pessimistic. 
    Who do you believe?
    Make sure you read all three articles:
    1. Charles Neener Predicts DOW 5,000
    2.  BTIG Fed Model With VIX Risk Adjustment
    3. Siegel and Schwartz Bond Bubble Warning
    Closing Data for Aug. 24, 2010:
    U.S. Indices
    Change
    Close
    Dow Jones
    -133.96
    10040.45
    NASDAQ
    -35.86
    2123.76
    S&P500
    -15.49
    1051.87

    DOW JONES INDU ^DJI - More charts
    S&P 500 - More charts


    Monday, August 09, 2010

    Bob Brinker's GNMA Advice

    Yesterday on Moneytalk a caller asked Bob Brinker if he should move his money (about $40,000) out of the Ginnie Mae (GNMA) fund Brinker recommends into something else. The caller was worried that interest rates could suddenly surge and cause the net asset value (NAV) of the fund to fall.
    For many years, Bob Brinker has recommended Vanguard's GNMA fund (VFIIX charts and more info) on Moneytalk.  He said he expected the fund to trade between $9.50 and $10.50 so the current price of $11.08 is well above his expectations but makes the advice even better.
    The caller's question is excellent because the 30 year chart here shows the fund fell in 1987 from about $10.20 to $8.60 or $1.60 in less than a year. 
    • ( $1.60 / $10.20) x 100% = 15.7%
    Brinker's advice to the caller was to use a mental stop-loss of $10.90. That means if the fund falls from Friday's close of $11.08 to $10.90, then you sell your position. That would protect your NAV decline to 18¢ or about 1.6% of Friday's price. Until then, you can continue to collect the interest that is currently yielding 3.15%.
    Vanguard GNMA "Ginnie Mae" Fund VFIIX
    Stop Loss Warning:  Brinker's advice to use a stop loss of $10.90 for VFIIX is good if you are able to execute it perfectly.  What happens if the fund falls in a day from $10.91 to $10.70?  Will you sell the next day at $10.70 or will you try and wait for a bounce to sell at $10.90?  My experience is people, even Brinker himself with his failed QQQ trade, often end up waiting for a bounce to sell into that never comes. 
    IF you are worried about NAV declines, then it might make it easier to sell to protect larger losses at $10.70 if you sell half the fund now at $11.08 and put the money into CDs.  That would still give you an average price of $10.90 should the fund gap down to $10.70 where you then sell the remainder of the fund if it gaps lower than your stop loss of $10.90.
    Another trick is set your stop loss HIGHER so you get out before those who follow Brinker's advice.  With Brinker's large listening audience, the gap down the day after VFIIX trades at $10.90 could be huge so perhaps set your stop at $10.95.

    History:
    Look at how quickly VFIIX jumped in 1987 when money poured out of stocks.

    Vanguard's GNMA Fund VFIIX in 1987

    Remember too that stocks were doing great in 1987 up until Black Monday.

    Vanguard's SnP500 Fund VFINX in 1987
    Those two charts show well how bond and stock funds usually go in opposite directions which is why they are so good for diversification.

    Many of the stocks in "Kirk's Newsletter Explore Portfolio" are paying a great dividend while selling at very low price to earnings multiples.  My portfolios are up significantly over the past 10 years while the index funds are down.   I expect equities to significantly out perform bonds and probably CDs over the next decade and my portfolio should do even better.


    and get the This Month's Issue for FREE!!
    Your 1 year, 12 issue subscription will start with next month's issue.

      Since 12/31/98 "Kirk's Newsletter Explore Portfolio" is UP 204%  vs. the S&P500 UP only 22% vs. NASDAQ  UP a only 19%   (All through 12/9/10) 
    In 2009, "Kirk's Newsletter Explore Portfolio" gained 33.5% vs. the DJIA up 18.8%

    2010 YTD my "Explore Portfolio" is up
    17.4% YTD
    (the explore portfolio has 70% in equities and 30% in fixed income so the stocks are doing very, very well)