Below these notes are a set of charts for this week's Market Update.
- I have a new set of
charts where you can watch the markets trade during the
day. I'm also adding 1-year charts to the individual stock
chart pages that have AI (Artificial Intelligence) to draw
resistance and support lines. A great example is this chart for SPY
that shows a "megaphone" or "broadening"
pattern.
- Since 3/9/20 I sent eight (8) Special Alert emails 📬 to my subscribers.
- 📬If you subscribe and did not get these, send me an email and I'll forward them all again.
- 📬If you wish to subscribe now, I'm offering the March issue for free now to new subscribers PLUS all back issues and Special Alert emails sent since the last newsletter are available, just ask.
Having raised cash, it is amazing how well I sleep at night despite the unexpected, sudden market sell-off.
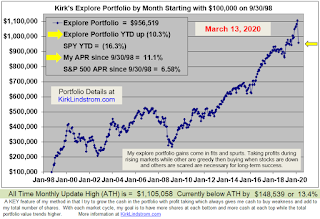
Closing Statistics for the low, so far on 3/12/2020:
My Explore Portfolio, down 10.3% YTD vs the S&P 500 via SPY down
16.3%.
Subscribe
NOW and get
the March 2020 Issue for FREE!!!
the March 2020 Issue for FREE!!!
More charts showing the bear market:
Here is proof that Bitcoin is
neither a currency or a store of value but just another
speculation.
The great news is investors sentiment is in the tank, hence the
reason I sent so many email alerts last week.
Subscribe NOW and get
the March 2020 Issue for FREE!!!
the March 2020 Issue for FREE!!!
DISCLAIMER:
The information contained in this newsletter
is not intended to constitute financial
advice, and is not a recommendation or
solicitation to buy, sell or hold any
security. This newsletter is strictly
informational and educational and is not to be
construed as any kind of financial advice,
investment advice or legal advice. Copyright
Kirk Lindstrom 2020.


