Hopefully you took some cash out of the markets near the highs to use to buy near the lows.
Keep checking back as I add sentiment charts over the weekend.
Here is a look at the markets on a closing basis. All are down between 8.0% and 14.8% from their peak values!
Markets at a Glance courtesy of WSJ
Here are the markets showing intraday values. With high speed computer trading, I believe intraday values are far more important than closing values. One reason is you can have a major reversal during a day when markets hit resistance points like their 50 and 200 day moving averages or round numbers like $25 or "down 20% from a peak."
This "Fear and Greed vs. the S&P 500 Sentiment Chart" shows now is a good time to be putting some cash back to work.
This are some of the "sell alerts" I sent my newsletter subscribers near the top.
This is one of my recent "buy alerts" I sent my newsletter subscribers this week.
As Bob Brinker used to say 20 years ago in his younger days "Intel is a great trading stock."
Click "Follow" to get email updates or subscribe to my newsletter to get the most important announcements and investment information.
Subscribe NOW and get
the October 2018 Issue for FREE!!!
the October 2018 Issue for FREE!!!
Nov. 1, 2018 Update
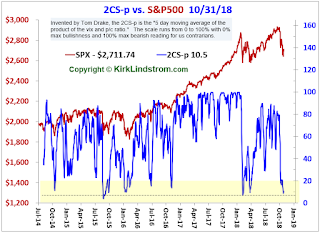
2CS-p Sentiment Indicator
More about 2CS
Keep checking back as I add more charts over the weekend.
Send me an email if you have any chart requests
...


No comments:
Post a Comment
Note: Only a member of this blog may post a comment.