Search Bob Brinker Fan Club Blogs

Showing posts with label bear market. Show all posts

Monday, October 10, 2022

Bear Market Update - Brinker Missed Another

The bear market that began at the start of the year continues with all four major markets I follow down over 20% from their peaks.

Using two significant figure accuracy, the markets are down between 21% and 34% from their peaks.


If you have a horse in the November "off presidential year election" then President Biden has not made 401(k) investors happy unless their portfolios are filled with crude oil and natural gas.  Investors in Bitcoin, are even less pleased.

 Markets & Bit Coin Under Biden


Markets & Crude Oil Under Biden


Markets, Natural Gas & Crude Oil Under Biden
In case you were interested, this is how the markets did under President Trump. 
We may not like the way Mr. Trump treated people nor his contentious tweets, but the Saudis, Russians and North Koreans were much better "behaved" while he was in office.  The stock markets reflected this with a quick recovery after the 2020 bear market.

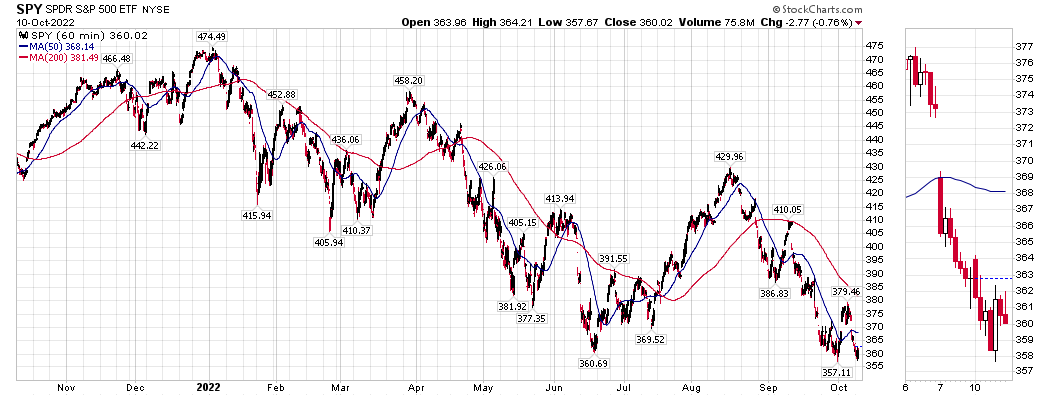
Here is an excerpt from my Newsletter.  SPY is slightly lower today...

9/22/22 After several great years, it was not a surprise that SPY had a 24.5% bear market, especially with such lofty valuations in many stocks. Last month SPY rallied to its 200-day moving average then headed lower to start testing the June lows. A new low to fill the “Head & Shoulder Top” target shown just off the graph below may occur. 


As the market is testing its bear market low sent in September, I was a buyer today and Friday with "Special Alert" emails sent to my subscribers.  

Bob Brinker's portfolios:  At the end of Q3 on September 30th, Brinker's fully invested portfolios one and two were down 26.9% and 26.2% YTD, respectively while the Total Stock Market and S&P 500 were down 24.9% and 23.95%, respectively. 


For comparison, my Explore Portfolio was down "only" 19.47% with my Aggressive Core Portfolio down 20.52% and my Conservative Core Portfolio was down 12.55%.

Three reasons I'm significantly ahead of buy and hold so far this year:
  1. I recommend cash in money funds rather that the Total Bond or other regular bond funds.

  2. I've recommended and hold significant holdings in iBonds that never go down and currently pay a very good return of between 9.62% and 9.83%! 
    Current Rates for New & Older I Bonds

  3. I took profits in all portfolios at the start of the year just as the markets were peaking.

Kirk Lindstrom's Investment Letter

To see what stocks and ETFs are on my buy list and what are my price targets:
 Subscribe NOW  and get
the
 October 2022 
Issue for FREE!!!
(If you mention this ad)

Saturday, April 11, 2020

Market Update 4/11/20 - Best Week Since 1974

Market Update 4/11/20: For the Easter holiday-shortened week, the S&P 500 surged 12.1% for its biggest one-week gain since 1974, while the Dow rallied 12% and the Nasdaq jumped 10.6%.
For the year, the Dow, S&P 500 and Nasdaq are down 16.9%, 13.7% and 9.1% respectively with the Russell 2000 still in bear territory down 25.3% YTD .


While the the Dow, S&P 500 and Nasdaq are now down less than 20% from their peaks, the Russell 2000 trails significantly at down 28.4%.

For years, Bob Brinker talked about Intel (INTC) and called it "a great trading stock." Hopefully you paid attention and learned to trade Intel around a core position. If not, you can get help from my newsletter.
I took profits in January at $66.57 then used the bear market decline to buy the shares back at a $14.65 discount ($66.57-$51.92=$14.65) in March.
Here is a copy of the email alert I sent my subscribers to REMIND them Intel reached the price I published in the newsletter for buying shares back.

More Intel charts.  The second chart has a very cool AI (Artificial Intelligence) feature that draws resistance and support lines on the one-year graph.


During the COVID-19 Bear Market Decline, I added to 15 of the 17 individual "issues" I cover in my newsletter for "Kirk's Explore Portfolio." That was a record as typically there are only one or two buys or sells during a month. I haven't worked so hard to send out alerts and update my newsletter with new target prices (listed on the full page coverage of each individual issue with a summary of all buy and sell prices updated on page 5 of each newsletter) since I started the newsletter in 1998! Order a Free Sample Issue if you wish to see what this looks like.
Now with the great, big rally from the bottom, we are very, very close to my "take profits" points for many of these stocks. Some are still closer to the buy points so it is not too late either. IF this turns out to be a long, secular bear market with cyclical bull market rallies, then I should continue to profit from that volatility.

Kirk Lindstrom's Investment Letter
Don't miss out!
 Get April Issue For Free!

Come discuss this article and more on my Facebook "Investing for the Long Term" group!

Saturday, March 14, 2020

Bear Market Update for March 13, 2020

Happy Pi Day! Market Update for Pi Day (3/14/2020):


Below these notes are a set of charts for this week's Market Update. 
  • I have a new set of charts where you can watch the markets trade during the day.  I'm also adding 1-year charts to the individual stock chart pages that have AI (Artificial Intelligence) to draw resistance and support lines.  A great example is this chart for SPY that shows a "megaphone" or "broadening" pattern.

  • Since 3/9/20 I sent eight (8) Special Alert emails 📬 to my subscribers. 
  • 📬If you subscribe and did not get these, send me an email and I'll forward them all again. 
  • 📬If you wish to subscribe now, I'm offering the March issue for free now to new subscribers PLUS all back issues and Special Alert emails sent since the last newsletter are available, just ask.
I hope you were like me and took considerable profits while the market was setting record high after record high since the 2018 Christmas Bear Market when the S&P 500 was last down over 20%.

Having raised cash, it is amazing how well I sleep at night despite the unexpected, sudden market sell-off.

Closing Statistics for the low, so far on 3/12/2020:
My Explore Portfolio, down 10.3% YTD vs the S&P 500 via SPY down 16.3%.

Subscribe NOW and get
the
March 2020 Issue for
FREE!!!

More charts showing the bear market:


Here is proof that Bitcoin is neither a currency or a store of value but just another speculation.

The great news is investors sentiment is in the tank, hence the reason I sent so many email alerts last week.


Subscribe NOW and get
the
 March 2020 Issue for 
FREE!!!

DISCLAIMER: The information contained in this newsletter is not intended to constitute financial advice, and is not a recommendation or solicitation to buy, sell or hold any security. This newsletter is strictly informational and educational and is not to be construed as any kind of financial advice, investment advice or legal advice. Copyright Kirk Lindstrom 2020.

Saturday, February 23, 2019

Bull Market Update - New Record High!

Weekend Market Update

After spending a short time down over 20% making a "Christmas Bottom" for the bear market, when it was a great time to buy (See Buy Alerts below) all major US markets are now out of the bear, out of the "10% correction zone" and nearing new highs again.


As of Feb. 23, 2019 I have a new RECORD high in my newsletter "Explore Portfolio" while the S&P 500 broke above its 200-day moving average but remains about 5% off its high. 


This last chart shows the markets vs the Fed Funds rate back to the mid 1990s.


 Subscribe NOW  and get
the
 March 2019 
Issue for FREE!!!
Recent articles:


Discuss this article on my "Investing for the Long Term" Facebook Group

Monday, December 24, 2018

Official Bear Market

Today the S&P 500 and Total Stock Market Index (VTSMX and its ETF VTI) entered official bear markets.
These are painful, but if you raised cash following my newsletter, then you have plenty of cash to go shopping during the Holiday Sales!

An example of some of my sell alerts


The infamous FAANG stocks (table below) remind me of the "Nifty Fifty" in many ways.

On a closing basis, you could stretch the truth and say we haven't hit an "official bear market" yet since the S&P 500 is "only down 19.8%.  But if you round to zero decimal places then the S&P 500 is down 20%.  


 Bob Brinker has taught for decades, what really matters is the Total Stock Market index (VTSMX) and that as well into a bear market due to the small cap stocks getting hit harder than the large cap stocks.

Discuss this article on my "Investing for the Long Term" Facebook Group here.

 Subscribe NOW  and get
the
 December 2018 
Issue for FREE!!!

Wednesday, May 02, 2012

Two Bear Markets Missed in Half a Decade

You don't hear Bob Brinker talk about this much since he was fully invested for both bear markets (See Brinker Asset Allocation History for full details.) but this is data worth keeping track of.
Bear Market Missed #1 in 2007 to 2009
High = 1576.09 Low = 666.79
Decline = 909.30 or 57.7% !!!

Bear Market Missed #2 in 2011: 
High = 1370.58 - Low = 1074.77 
Decline = 295.81 or 21.6% 

 (Click this chart to see the highs and lows circled.)


You have to chuckle that he calls his newsletter "Marketimer" when he has been 100% in equities for the last nine years without raising any cash for the "Great Recession" that was a bear market over 50%.  He had another chance last year to raise cash before another bear market but he rode that one out too.

Brinker should change the name of his newsletter to "Buy_And_Holder."

To Bob Brinker's credit, the markets are not that far from their all time highs but how many stuck with him and his multiple "buy signals" as the market plunged between the top in 2007 and mid 2009 when he started to give buy signals again after stopping near the lows?

Saturday, October 11, 2008

Bear Market Reaches 47% from the top. Bob Brinker Fully Invested for the full decline.

This graph of the S&P500 back to 2002 says it all. Below the chart are the current statistics for this bear market that is currently 43% off its peak value just a year ago.

Click image courtesy of stockcharts.com to see in full size

2007-2008 Bear Market Statistics 10/11/08

S&P500 Chart
Last Market High 10/11/07 at 1,576.09
Last Market low 10/10/08 at 839.80
Current S&P500 Price 899.22
Decline in Points = 676.87
Decline in percent = 42.9%
Max Decline = 46.7%
=>This means the decline from intraday high to intraday low is 46.7% and we are currently 42.9% off the peak.

=>The decline in the S&P500 from the closing high to the closing low was 42.5%

DJIA Charts
Last Market High 10/11/07 at 14,279.96
Last Market Low 10/11/08 at 7,773.71
Current DJIA Price 8,451.19
Decline in Points = 5,828.77
Decline in percent = 40.8%
Max Decline = 45.6%
=>This means the decline from high to low has been 45.6% and we are currently 40.8% off the peak.

=>The decline in the DOW off the closing high to the closing low was 40.3%

NASDAQ Charts
Last Market High 10/31/07 at 2,861.51
Last Market Low 10/10/08 at 1,542.45
Current NASDAQ Price 1,649.51
Decline in Points = 1,212.00
Decline in percent = 42.4%
Max Decline = 46.1%
=>This means the decline from intraday high to intraday low is 46.1% and we are currently 0.4235526 42.4% off the peak.

=>The decline in the NASDAQ off the closing high to the closing low was 42.5%

If you want to know what I have been buying in this period of weakness with my profit taking dollars from selling when the market was higher, Subscribe to Kirk's Investment Newsletter TODAY!

Tuesday, October 07, 2008

Bear Market Reaches 37% from the Top

If anyone still thinks Bob Brinker, or anyone else for that matter, can time the market, then they should have their head examined.

From the peak, the S&P500, DJIA and NASDAQ are down 37%, 35% and 39% respectively. Bob Brinker has been fully invested for the whole ride while giving buy signals for those with "new money" in the mid 1400s, 1300s and 1200s. Since the market went through his last buy level like a hot knife through better, he's back at "dollar cost average" new money as he looks to "identify" a new bottom.

I bought some stock yesterday and today so maybe I too should have my head examined for putting some of my cash at risk.

Despite all the evidence that nobody can time the markets, I like to play around with a tiny fraction of my explore portfolio to see if I can add any value with it. When the DOW broke support at about 12,000, the minimum target was 9,500. We are there now which makes me wish I'd used my 20:20 hindsight to sell everything when the markets were high to start buying back now. Of course, so does every other asset allocator on the planet which is why market timing has such appeal despite the evidence nobody can do it over the very long term.

Kirk's Asset Allocation Advice: I like the rule-of-thumb "120 less your age in equities." The equities should be a globally diversified basket of index funds such as the "core portfolios" I recommend in "Kirk Lindstrom's Investment Newsletter." For example, if you are 40 years old and don't plan to retire for 20 or more years (unless you get lucky with some of my "explore portfolio" stock picks) then you would have 80% in equities and 20% in fixed income. If you are well into critical mass, then put even less into equities and get inflation protection from TIPS since you don't need the extra "expected" return from equities at the much higher volatility (risk.)

Here are the latest bear market statistics.

2007-2008 Bear Market Statistics 10/07/08

S&P500 Chart
Last Market High 10/11/07 at 1,576.09
Last Market low 10/07/08 at 996.23
Current S&P500 Price 996.23
Decline in Points = 579.86
Decline in percent = 36.8%
Max Decline = 36.8%
=>This means the decline from intraday high to intraday low is 36.8% and we are currently 36.8% off the peak.
=>The decline in the S&P500 from the closing high to the closing low was 36.3%

DJIA Charts
Last Market High 10/11/07 at 14,279.96
Last Market Low 10/07/08 at 9,346.67
Current DJIA Price 9,447.11
Decline in Points = 4,832.85
Decline in percent = 33.8%
Max Decline = 34.5%
=>This means the decline from high to low has been 34.5% and we are currently 33.8% off the peak.
=>The decline in the DOW off the closing high to the closing low was 33.3%

NASDAQ Charts
Last Market High 10/31/07 at 2,861.51
Last Market Low 10/07/08 at 1,754.88
Current NASDAQ Price 1,754.88
Decline in Points = 1,106.63
Decline in percent = 38.7%
Max Decline = 38.7%
=>This means the decline from intraday high to intraday low is 38.7% and we are currently 0.386729384 38.7% off the peak.
=>The decline in the NASDAQ off the closing high to the closing low was 38.6%

If you want to know what I have been buying in this period of weakness with my profit taking dollars from selling when the market was higher, Subscribe to Kirk's Investment Newsletter TODAY!

FREE Updates Mailing List


We email regular "FREE Bob Brinker Fan Club Updates" to everyone on our "Bob Brinker Fan Club" distribution list. If you would like to get on this list, then click this link.


Top Rated Newsletter


Timer Digest Features
Kirk Lindstrom's Investment Letter
on its Cover

Cick to read the full page article!


US Treasury Rates at a Glance - iBond Rates - LIBOR Rates

Must Read:
Beware of Annuities - Payday Loans Warning