Search Bob Brinker Fan Club Blogs

Friday, August 29, 2008

Bob Brinker's MOABO: August in Review

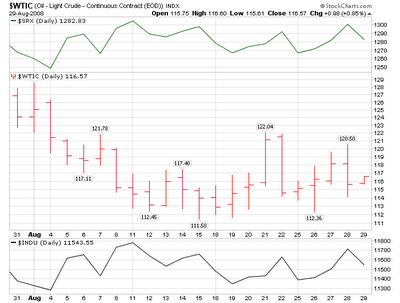
Oil prices fell another 8% in August, down to about $116, while the markets overall basically went nowhere. (Officially the markets had a small gain in August but this chart shows the last month which is 30 days back into late July)

Bob Brinker says the price of oil is a wildcard. On the July 12 Moneytalk, Brinker said:
"Here we see oil having closed the week at an all-time-record-high, close to $145 for a barrel of oil………..And there is an inverse relationship that has developed between upward spikes in oil prices and the stock market, and that inverse relationship has really been showing up now for some time.

The stock market wants to see an economic recovery scenario. It does not want to see an increased oil price scenario, which is was it’s seeing right now. Now I wish I could tell you what the price of oil is going to be in a week, a month, a year. I don’t know. I have no way of knowing and I think only a fool would try to forecast the price of a barrel of oil in the world we live in……. [Full story]
Concerns over the economy, inflation and troubles in the financial sector weighed heavy on investors in August despite oil prices falling about $9 from $125 to $116


Despite being fully invested since March 2003 and riding this bear market down fully invested, Bob Brinker issued yet another "all in the pool" buy level in the low 1200s in early August. So far, that was too late to do anyone any good as the market had already recovered by the time he issued a the latest buy level.

Brinker's Model Portfolio #1 (P1) Performance
(Data from Bob Brinker's Marketimer for end of month totals)
Brinker P1 as of 10/31/07 = $302,561
Brinker P1 as of 07/31/08 = $249,993
Thus P1 is down $52,568 or 17.4%
Gain required for P1 from 7/31/08 to "break-even" with its 10/31/07 value is 21.0%

I will update this table with the August numbers as soon as they are published, but from the top graph, I would not expect them to be very different.

Bob Brinker's MOABO

I sure hope the markets have made a bottom and they do not go lower. As an asset allocator and stock picker who does not short stocks, I would love to see the market go up all the time with the occasional correction to buy back profit taking shares to add to my returns.

It would sure be ironic if Bob Brinker's original prediction of a secular bear market with a MOABO (mother of all buying opportunities) at the end of that bear market, turns out to be true. I imagine he is kicking himself raw for calling for new highs in 2008 last year just as the bear market was starting.

Wednesday, August 27, 2008

Bob Brinker on Obama Tax Plan Marginal Rate

Honeybee's summary of Bob Brinker's Sunday's Moneytalk show contains Brinker's comments on Senator Barack Obama's proposed tax plan.
"Brinker went on to explain how easy it would be (under the Obama tax plan) to construct this 60%+ marginal tax bracket for a lot of American entrepreneurs who create jobs."
It looks like Brinker was talking about the MARGINAL TAX RATE and I believe his numbers are correct.

Marginal tax rate is the effective tax you pay on additional income above the threshold, $250,000 in this case. You already deducted your home mortgage, etc. so that is not relevant in this discussion.

That is if you make $260,000, how much tax will you pay on that extra $10,000 under Obama vs McCain. He seems to have made an allowance for deducting state taxes since his number is less than adding up all the components.

Brinker showed how, in a high tax state like California or New York, the marginal rate for those making over $250,000 AGI will be about 62%.

Lets do a quick comparison (2008 tax rates)

Current Federal Taxes under Bush Tax Plan for single taxpayers who own their own business (pay both sides of Social Security tax) making $260,000:
Marginal Federal tax rate = 33%
Social Security Tax = 0% + 0% = 0%
Medicare Tax = 2.9%
Total = 35.9%
Proposed Taxes under proposed Obama Tax Plan for single taxpayers making $260,000 :
Marginal Federal tax rate = 39.6%
Social Security Tax = 6.2% + 6.2% = 12.4%
Medicare Tax = 2.9%
Total = 54.9%
Change in tax rate 54.9% - 35.9% = 19%

So under the Obama tax plan, small business owners who have to pay both sides of the Social Security tax will see their Federal tax rate on what they make in excess of $250,000 skyrocket (19%/35.9% x 100%) 53% in total tax dollars paid.

For California, he got the numbers close. The marginal tax rate in CA is 9.3%. Under current law, this is deductible on your federal return.

Current marginal Fed + CA Tax Rate:
35.9% + 9.3% x (1 - .33)
35.9% + 6.3%
Total = 42.1%
Marginal FED + CA Tax Rate under Obama:
54.9% + 9.3% x (1 - .396)
54.9% + 5.6%
Total = 60.5%
A 60.5% marginal rate in California means that a small business owner who makes $260,000 will pay $6,050 in taxes on that $10,000 above $250,000. Under the Bush tax plan, she now only pays $4,210.

If Brinker only has 20,000 subscribers to his newsletter (we have read he has as much as 200,000 subscribers) then his gross income is about $3.7 million! ($37 million income if he has the reported 200,000) It is not in his best interest to want higher taxes and I can't fault him for doing all he can to keep his rates low. His listeners only need to know he is not unbiased.

Obama supporters say those making over $250,000 should pay this extra $1,840 in tax for every $10,000 they make above $250,000 since they are doing so well under the current plan and can afford it. They also say McCain's plan will raise taxes on middle income workers by adding employer paid health care to taxable income. Let me know if there is a complete analysis with all the proposed changes to compare the two tax plans for all income groups.

Please leave comments about any tax rate changes, errors or omissions. Please note I am just a writer with a calculator, not a tax accountant so there could be some errors in my assumptions. Please feel free to point them out in the comments section.

Thursday, August 21, 2008

Bob Brinker Bear Market Quotes

The cyclical bull market that began on October 9, 2002 ended when it made a final intraday high of 1576.09 on October 11, 2007.

The current cyclical bear market started at the top but was not an "official bear market" by Bob Brinker's definition of a bear market until it closed below 1252.01, the dashed red line on the chart below.

Lets take a look back over the past year or so to see what Bob Brinker has been saying.

October 05, 2007: Bob Brinker Bullish and Fully Invested
"Bullish. In his most recent issue, published in early October, editor Bob Brinker wrote: "We expect significant additional stock market progress into next year as investors discount growing corporate earnings in an environment of low inflation and benign interest rates." His model portfolios are fully invested."
(S&P500 was 1542)
November 15, 2007: Bob Brinker Still Bullish According to Mark Hulbert
In his article "The best vs. the worst: Best long-term market timers believe we're in a bull market," Mark writes of Bob Brinker:
Bob Brinker's Marketimer: Bullish. In his most recent issue, which was published in early November, editor Bob Brinker writes: "We continued to believe that there is no risk of a cyclical bear market (a decline of 20% or more as measured by the S&P 500 index (S&P500 chart) in the months ahead ... We expect the stock market to set a series of new record highs into next year." His model portfolios are fully invested.
December 19, 2007: Brinker's Long-in-the-Tooth Buying Opportunity
So far, Brinker has been correct that a 20% bear market has not happened. However, those who bought into the stock market last August when he issued his "mid-1400's" buy signal have needed great patience if they are waiting for his July prediction of 1600's range to develop.

In July, 2007 Marketimer, Bob Brinker predicted a "move into the S&P 500 Index 1600's range as we move forward....."

In August, 2007 Bob Brinker said: "We rate the stock market as attractive for purchase on weakness that occurs in the area of the S&P 500 Index mid-1400's. Above that level, we recommend a dollar-cost- average approach."
.
Brinker repeated the "mid-1400's" buy signal in September, October, November and December (2007).
January 04, 2008: Brinker's 60-day Moving Average Put/Call Ratio Indicator Remains Bullish

In his January Marketimer, Bob Brinker reported:

"The 60-day put/call ratio remains in bullish territory as the new year begins."

Brinker remains bullish, does not expect a bear market (as defined as a 20% or more decline in the S&P500) and he looks for new highs to be made in the year ahead.

February 22, 2008: Bob Brinker Likes Low 1300s According to Peter Brimelow

About Bob Brinker, Brimelow wrote:

Brinker said recently: "Marketimer views the establishment of a correction bottom as a process which unfolds over a given period of time. This process involves the initial establishment of a closing S&P 500 Index low, followed by a short rally, followed by a test of the area of the previously established low on reduced trading volume. The initial closing low in the current stock market correction process occurred on Jan. 22, when the S&P 500 Index closed at 1310.50. The market subsequently rallied for eight days, at which point it began the process of testing the area of the Jan. 22 closing low."

"In our view, the correction bottoming process has proceeded with a high degree of historical consistency to date. We have witnessed a decided reduction in selling pressure during the testing process, which is essential to a successful outcome. We now rate the stock market attractive for purchase on any weakness that occurs in the current area of the S&P 500 Index low 1,300s, or any minor weakness that occurs below that level."
June 03, 2008: Bob Brinker's June Market Outlook
According to newsletter tracker Mark Hulbert, Bob Brinker remains bullish for June 2008. In "Lion or lamb?" Mark wrote:
  • Bob Brinker's Marketimer: Bullish. In his most recent issue, which was published in early June, editor Bob Brinker wrote that his market timing model "remains in favorable territory as we approach the start of the summer season. We continue to expect stock prices to work higher and to achieve new historic highs in the market indexes." Brinker's model portfolios are fully invested.
    .
    [Kirk Comment: Brinker's model portfolios have been fully invested since March 11, 2003. See Bob Brinker's Asset Allocation History. ]

If you want to read what Brinker says in full, then you have to subscribe to Marketimer. Good luck trying to get any past issues which have these bullish market calls in them.
"The idea that a bell rings to signal when investors should get into or out of the stock market is simply not credible. After nearly fifty years in this business, I do not know of anybody who has done it successfully and consistently. I don't even know anybody who knows anybody who has done it successfully and consistently. Yet market timing appears to be increasingly embraced by mutual fund investors and the professional managers of fund portfolios alike. }
[John C. Bogle in Common Sense on Mutual Funds: , pg 20]
Unlike Brinker, I don't try to time the stock market but for a tiny part of my explore portfolio. Also, I offer subscribers of "Kirk Lindstrom's Investment Newsletter" any back issue they want for free. I have nothing to hide.

Kirk's Investment Newsletter
Corvette driving into mailbox

To find out how I've profited greatly from these difficult market conditions, subscribe to "Kirk Lindstrom's Investment Newsletter" today!
  • Since 1/1/1999 through 7/31/08 my "explore" portfolio is up 180% while the S&P500 is only up 19% and Warren Buffett's Berkshire Hathaway is only up 62%
    .
  • Subscribe TODAY and get the August 2008 issue for FREE!

Saturday, August 16, 2008

For Brinker, Three Strikes Is Not An Out

How many people have money left over for a new buy level after three "all in buys" at 1380, the mid 1400s and low 1300s?

3-strikes is not an out for Bob Brinker
Click charts courtesy of stockcharts.com for full size images

Bob Brinker has been recommending a "fully invested" position in the stock market since March 2003. (See Bob Brinker's Asset Allocation History.)

We can only speculate why Bob Brinker keeps giving "all in" buy levels. How useful are new buy levels every time the market drops?

Since March 2003, Brinker has recommended investors be FULLY INVESTED in the stock market. If they get any "new money" say from winning the lottery or a big inheritance, then they are to dollar cost average that money into the market except for when the market drops into one of his "BUY ZONES" where he recommends a lump sum (immediate) investment in equities. Here are some of my ideas why he has given four "all in buys" in the past 18 months without a single "take profits" or sell signal.
  • His subscribers have a short memory and only remember the latest buy level so he will eventually look brilliant to some of them.

  • He has a high turnover of subscribers when he has periods of poor market timing. Since he does not talk about past mistakes in detail in his newsletter, new subscribers have no idea his prior buy levels were a bust nor do they know he was advising a fully invested position through the latest bear market from its peak at 1565. To them, he might look like he called the bottom should one of the buy levels turn out to be a bear market bottom.

  • His 8 page Marketimer newsletter has three pages of new text each month with the remaining 5 pages filled with performance tables. Perhaps Brinker can't find anything else to write about to fill the three pages of new text each month.
Did I miss any?

Feel free to use to comments section to add your ideas.

Friday, August 15, 2008

Oil Prices At Major Support Levels

Bob Brinker (Fan Club) said the price of oil is "directly correlated" to the stock market and only a "fool" believes he (the fool) can predict the price of Oil.
"Oil prices have fallen lately. We include this news for the benefit of gas stations, which otherwise wouldn't learn of it for six months." -- William D. Tammeus
During his July 12, 2008 Moneytalk show, Bob Brinker said:
"Now I wish I could tell you what the price of oil is going to be in a week, a month, a year. I don’t know. I have no way of knowing and I think only a fool would try to forecast the price of a barrel of oil in the world we live in…….”
The price of oil, West Texas Intermediate crude (more WTIC Charts) specifically, broke its steep 2008 support level (dashed green line in graph below) last month. Currently oil prices are testing the 20-month support line (dashed blue line) from the start of 2007.

Click charts courtesy of stockcharts.com for full size images

Bloomberg: Oil Steady After Falling on Signs Fuel Use Decline Will Spread
  • Gasoline demand was down 2.1 percent through July as record prices and slower economic growth cut consumer spending.
  • "The market is much more focused on demand destruction than on supply concerns,'' said Nauman Barakat, senior vice president of global energy futures at Macquarie Futures USA Inc. in New York. "The concern now is that the demand destruction in the U.S. will spread like a virus to other countries.''
We will need to see improvement in the credit markets for the stock market to make new highs but this decline in the price of oil should help the markets move out of the 1200s. XLF is the financial sector spider, a subset of SPY.

The chart below clearly shows the stock market has been led by problems in the financial sector, not the price of oil. The price of oil is an important variable in corporate profitability and consumer spending, but there is no direct correlation.

These charts make it easy to see the the stock market rallied early in the year as oil prices went up and it fell as oil prices continued to rise. The direct correlation is between the S&P500 and XLF, not oil prices.

In his August 2008 Marketimer, Bob Brinker said:
"We believe a good case can be made for oil prices to trend toward the $100 per barrel level into 2009."
If the stock market continues to rally and oil prices break support, then Bob Brinker's latest buy level may have come too late. (I'd rather not be the first to give this new "All-In Buy Level" number in respect for his paying subscribers.)

3-strikes is not an out for Bob
Of course, how many people have money left over after "all in buys" in the mid 1400s and low 1300s given Brinker has been recommending a "fully invested" position in the stock market since March 2003? (See Bob Brinker's Asset Allocation History.)

Kirk's Investment Newsletter
Corvette driving into mailbox

To find out how I've profited greatly from these difficult market conditions, subscribe to "Kirk Lindstrom's Investment Newsletter" today!
  • Since 1/1/1999 through 7/31/08 my "explore" portfolio is up 180% while the S&P500 is only up 19% and Warren Buffett's Berkshire Hathaway is only up 62%
    .
  • Subscribe TODAY and get the August 2008 issue for FREE!
.

Sunday, August 03, 2008

Two Years of Nothing: Bear Market Update

Bob Brinker has been fully invested since March 2003. Today we are in a bear market. The S&P500 at 1260 today is a bit lower today than it was two years ago and it is down 20% from "double top" it made about a year ago. I think this chart is worth many thousands of words.
Click charts courtesy of stockcharts.com for full size images

Note in the chart above I show the 200 DMA [200 day moving average or MA(200)] for the S&P500. During the bull market, the 200 DMA is support but during bear markets, it becomes resistance.

2007-2008 Bear Market Statistics 08/03/08

S&P500 Chart
Last Market High 10/11/07 at 1,576.09
Last Market low 07/11/08 at 1,200.44
Current S&P500 Price 1,260.31
Decline in Pts 315.78
Decline in % 20.0%
Max Decline 23.8%
  • =>This means the decline from intraday high to intraday low is 23.8% and we are currently 20.0% off the peak.
  • =>The decline in the S&P500 from the closing high to the closing low was 22.4%... so far! Lets hope that is all.
DJIA Charts
Last Market High 10/11/07 at 14,279.96
Last Market Low 07/15/08 at 10,827.71
Current DJIA Price 11,326.32
Decline in Pts 2,953.64
Decline in % 20.7%
Max Decline 24.2%
  • =>This means the decline from high to low has been 24.2% and we are currently 20.7% off the peak.
  • =>The decline in the DOW off the closing high to the closing low was 22.6%

NASDAQ Charts
Last Market High 10/31/07 at 2,861.51
Last Market Low 03/17/08 at 2,155.42
Current NASDAQ Price 2,310.96
Decline in Pts 550.55
Decline in % 19.2%
Max Decline 24.7%
  • =>This means the decline from intraday high to intraday low is 24.7% and we are currently 19.2% off the peak.
  • =>The decline in the NASDAQ off the closing high to the closing low was 24.1%
Lets hope the bottom is in and Brinker does not get an opportunity to issue yet another buy signal in the 1100s or lower!

Click the flag pictures to see


Major World Market Graphs At A Glance: Daily 5 Days 1 Yr

Kirk's Investment Newsletter
Corvette driving into mailbox

To find out how I've profited greatly from these difficult market conditions, subscribe to "Kirk Lindstrom's Investment Newsletter" today!
  • Since 1/1/1999 through 7/31/08 my "explore" portfolio is up 180% while the S&P500 is only up 19% and Warren Buffett's Berkshire Hathaway is only up 62%
    .
  • Subscribe TODAY and get the August 2008 issue for FREE!

John Bogle's Bear Market Advice

John (Jack) Bogle, Vanguard Founder and author of Common Sense on Mutual Funds, was on CNBC recently to give his advice to investors.

Jack's 7/14/08 advice on what to do in this 2007-2008 bear market:
"Get your balance right. Have a certain amount in bond funds, bond index funds or Pimco funds for that matter because Paul (McCulley, PICMCO managing director) has done a fabulous job out there. Paul and Bill (Gross, PIMCO Founder and director). Take your equity position and make it 80% say US, 20% non US. Get your balance having something to do with your age. More bonds as you get older like I am and stay the course. "
Sounds just like my "core and explore" advice! Don't try to time the market and use asset allocation.

John Bogle, a regular guest on Moneytalk, and most other experts say they have never met anyone who can time the stock market.
The idea that a bell rings to signal when investors should get into or out of the stock market is simply not credible. After nearly fifty years in this business, I do not know of anybody who has done it successfully and consistently. I don't even know anybody who knows anybody who has done it successfully and consistently. Yet market timing appears to be increasingly embraced by mutual fund investors and the professional managers of fund portfolios alike.
[John C. Bogle in Common Sense on Mutual Funds: , pg 20]
But John does approve of explore portfolios and has said he has one himself where he invests in managed funds at Vanguard. Bogle on Managed Mutual Funds:
Actively managed mutual funds? Yes. But only if they are run by managers who own their own firms, who follow distinctive philosophies, and who invest for the long term, without benchmark hugging. (Don't be disappointed if the managed fund loses to the index fund in at least one year of every three!)"
[John C. Bogle in “The Little Book of Common Sense Investing”, Chapter 18]
I've read and watched Jack Bogle over the years and his advice is quite similar to mine. He just says it differently. I believe most investors should place 80 to 95% of their assets into a globally diversified basket of index funds I call my "core portfolio" that is allocated between stocks and bonds based on your age. Then you try to beat the return of the core portfolio over the long term with the remaining 5% to 20% that you invest in managed mutual funds or manage an "explore portfolio" yourself to see if you have what it takes to beat the markets.

Kirk's Investment Newsletter
Corvette driving into mailbox

To find out how I've profited greatly from these difficult market conditions, subscribe to "Kirk Lindstrom's Investment Newsletter" today!
  • Since 1/1/1999 through 7/31/08 my "explore" portfolio is up 180% while the S&P500 is only up 19% and Warren Buffett's Berkshire Hathaway is only up 62%
    .
  • Subscribe TODAY and get the August 2008 issue for FREE!

Friday, August 01, 2008

Vanguard Funds YTD Returns Through July 31, 2008

Bob Brinker discusses many of these funds on his "Moneytalk" radio show. He also recommends some of these in his "Marketimer" newsletter.

Vanguard
Fund Name
Symbol Price as of 07/31/2008 YTD Returns
as of
07/31/2008
Price Yield
500 Index Fund Inv VFINX $116.85 2.16%
–12.70%
CA IT Tax-Exempt Investor VCAIX $10.73 3.80%
0.63%
Emerging Mkts Stk Idx Inv
VEIEX $28.03
–15.37%
European Stock Index Inv
VEURX $33.82
–14.98%
Extended Mkt Index Inv VEXMX $36.78 0.88%
–7.77%
GNMA Fund Investor Shares VFIIX $10.22 5.04%
1.46%
High-Yield Corp Fund Inv
VWEHX $5.46 9.15%
–3.21%
Inflation-Protect Sec Inv VIPSX $12.62 0.96%
4.58%
Inter-Term Bond Index Inv VBIIX $10.31 5.05%
0.94%
International Growth Inv
VWIGX $21.32
–14.10%
Long-Term Bond Index VBLTX $11.17 5.75%
–1.07%
Pacific Stock Index Invs VPACX $11.32
–11.01%
Prime Money Mkt Fund VMMXX $1.00 2.21%
1.74%
REIT Index Fund Inv
VGSIX $19.97 note
–0.33%
Short-Term Bond Index Inv VBISX $10.11 3.62%
2.14%
Target Retirement 2025 VTTVX $12.45 2.82%
–9.26%
Tax-Exempt Money Mkt VMSXX $1.00 2.32%
1.34%
Total Bond Mkt Index Inv VBMFX $9.99 4.72%
1.07%
Total Int'l Stock Index
VGTSX $17.07
–14.18%
Total Stock Mkt Idx Inv VTSMX $30.98 1.99%
–11.60%
Brinker Model Portfolio #1


-11.9%
Brinker Model Portfolio #2


-10.9%
Brinker Model Portfolio #3


-6.4%
Kirk's Explore Portfolio


-5.9%

The big winner was Vanguard's Inflation Protected Securities fund, VIPSX, up 4.58% YTD

The big losers were international stocks down 15 to 16% while the S&P500 was not far behind down about 13% (12.70%) YTD.

Click charts courtesy of stockcharts.com to see full size images

It has not been a good year to be fully invested in the stock market, especially if you write a newsletter called "Marketimer."
Last weekend, Bob Brinker said:
  • Caller Gary: “I was just wondering what your opinion was on the market returning to its previous highs?

    .....some clarification....

    Brinker replied: “Oh, I would say within your time-frame of 1 to 3 years, would the market get to new all-time-highs in the S&P 500? For me I think the answer would be without question – that would be my opinion. Would the market get to new all-time-highs within your time-frame of 1 to 3 years? Yeah. For me, my opinion on that would be -- without question."

  • For the full discussion, see Bob Brinker Sees New Market Highs
For those of us who use asset allocation, lets hope Bob Brinker is correct and the markets make new highs in the next one to three years. It is more fun to listen to Brinker bash his "Bad News Bears" than it is to rehash Ginnie Maes!

Disclaimer: I own many of the funds listed and recommend many of them in my newsletter.

Kirk's Investment Newsletter
Click for a FREE SAMPLE issue
(should open an email window)
Corvette driving into mailbox

To find out how I've profited greatly from these difficult market conditions, subscribe to "Kirk Lindstrom's Investment Newsletter" today!
  • Since 1/1/1999 through 7/31/08 my "explore" portfolio is up 180% while the S&P500 is only up 19% and Warren Buffett's Berkshire Hathaway is only up 62%
    .
  • Subscribe TODAY and get the August 2008 issue for FREE!

Very Best CD Rates Website

Announcing the "Very Best CD Rates" Website with advice about FDIC insurance that agrees with Bob Brinker's advice.

Excerpts:
You can often get higher than advertised rates at your local branch if you do your homework. Print out our "Highest CD Rate Survey" and bring it in with you. Print out some of the advertisement of rates advertised on your bank's competing web sites so you have proof.

Rates and terms may change so read the fine print and make sure you get FDIC insurance!!!!
It costs money to get new accounts so Banks often give you a deal if you are ready to walk out the door with a chashier's check after you close your CD.

Bottom line: It never hurts to ask the teller if better rates are available when you do your homework!
Get the latest "Highest CD Rate Survey"

FREE Updates Mailing List


We email regular "FREE Bob Brinker Fan Club Updates" to everyone on our "Bob Brinker Fan Club" distribution list. If you would like to get on this list, then click this link.


Top Rated Newsletter


Timer Digest Features
Kirk Lindstrom's Investment Letter
on its Cover

Cick to read the full page article!


US Treasury Rates at a Glance - iBond Rates - LIBOR Rates

Must Read:
Beware of Annuities - Payday Loans Warning