A caller asked Bob Brinker today if now was the time to get out of US Treasuries, especially Bob's favorite GNMA fund from Vanguard.. The caller also asked about selecting individual companies. Brinker said he preferred to buy an index fund of the total stock market thus eliminating the risk of under performing the market. He went on and on about the advantages of index funds for individual investors, advice I agree with for your core portfolios. I think many of us enjoy beating the market (or attempting to for many) with individual stocks so that is fine for the "explore" part of your "core and explore" portfolio.
As for GNMAs, Bob said he still recommends Vanguard's GNMA fund (Ticker VFIIX - VFIIX charts). Bob said he is still looking at the Vanguard GNMA fund trading between $9.50 and $10.50 which he says is no change in his outlook. He said if you are fine with that range and can accept the NAV variation, then he recommends holding.
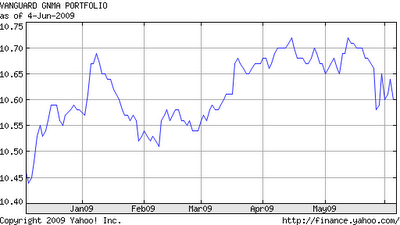
Kirk's Comment: VFIIX closed at $10.54 Friday, down from its recent high of $10.72. It seems rather sloppy that Brinker has not adjusted his standard GNMA reply to reflect this new data above $10.50.
This chart shows VFIIX over the last six months clearly showing VFIIX well above $10.50.
 This chart shows VFIIX back to 1987, when interest rates were much higher. You can see that the net asset value (NAV) of the fund fell under $9.50 for a significant period of time. I suspect it could go even lower if we were to get high inflation like we saw in the 1970s and early 1980s.
Lets say the NAV drops from $10.54 to $9.50. That would be a decline of $1.04. In percent, that decline would be:
- $1.04 / $10.54 x 100% = 9.9%
Also note that if interest rates soar, the fund could go much lower than $9.50.
To be safe, if you own the fund, you might ask yourself how you would feel if the NAV fell to $9.00 again.
Update later in the day. I added another chart of VFIIX below back to 1980 when we had double digit inflation and US Treasury rates were around 14%! Note that the NAV of the fund got as low as $7.50. From today's $10.54, this would be a decline of 34%!
Doubled Money in a Down Market!
Since 12/31/98 "Kirk's Newsletter Explore Portfolio" is UP 113% (over a double!) vs. the S&P500 DOWN 9% vs. NASDAQ down 16% vs. Warren Buffett's Berkshire Hathaway (BRKA) up 28% (All through6/4/09 )
Since 12/31/98 "Kirk's Newsletter Explore Portfolio" is UP 113% (over a double!) vs. the S&P500 DOWN 9% vs. NASDAQ down 16% vs. Warren Buffett's Berkshire Hathaway (BRKA) up 28% (All through
As of June 4, 2009, "Kirk's Newsletter Explore Portfolio" is up 10% YTD
vs. DJIA DOWN 0.3%
(More Info & FREE Sample Issue)
vs. DJIA DOWN 0.3%
(More Info & FREE Sample Issue)
HURRY! Subscribe NOW and get the June 2009 Issue of "Kirk Lindstrom's Investment Newsletter" for FREE! !

More Fixed Income Charts for:
More Fixed Income Charts for:


No comments:
Post a Comment
Note: Only a member of this blog may post a comment.