Search Bob Brinker Fan Club Blogs

Friday, October 24, 2014

Did You Buy on the 10% Correction Weakness?

For several years Moneytalk host Bob Brinker has said he likes to dollar cost average on weakness with new money.  By my eyes, this chart shows the market corrected by 10% and many stepped in to buy which caused the market to soar.

Note too that this correction touched my dashed green support line and the depth of the correction was the "best weakness" the market has seen going back to 2012!

Intraday "Correction" Statistics for 10/24/14

See S&P500 Chart
  • Last Market High 09/19/14 at 2,019.26
  • Last Market low 10/15/14 at 1,820.66
  • Current S&P500 Price 1,964.58
  • Decline in Points = 54.68
  • Decline in percent = 2.7%
  • Max Decline = 9.8%
=>This means the decline from intraday high to intraday low is 9.8% and we are currently only 2.7% the all-time record high.

On October 13, I posted this FREE blog article:

On October 15, I posted this FREE blog article:
Did you do any buying on the recent 10% weakness?

I did!  I also sent email alerts to my newsletter subscribers announcing we reached some of my buy targets published in my September newsletter as a reminder.

For more market data, see:


Thursday, October 16, 2014

Brinker Fixed Income Advice & Stock Market Returns 2014 YTD

Yesterday all markets (not counting dividends) closed in the red.

Bob Brinker's Marketimer newsletter has an "Income Portfolio" but Bob Brinker doesn't usually report monthly results for it.  This year the bond market has surprised many with how well it has done despite the fear of the Federal Reserve increasing the Fed Funds short term rates in 2015.


This article is an update of our Sept. 12, 2014 article;
"Bob Brinker's Marketimer Income Portfolio and Radio Advice for Cash"
This graph compares the four funds in the Marketimer Income Portfolio with Vanguard's GNMA fund and the Total Bond index fund.

Fund summary:
  • DLSNX, up 1.46% YTD
  • FFRHX, up 0.79% YTD
  • MWLDX, up 1.59% YTD
  • OSTIX, up 1.86% YTD
With 25% in each at the start of the year, the average is +1.425% YTD.

Compare that to:
  • Vanguard GNMA fund, VFIIX, up 6.16% YTD
  • Vanguard Total Bond Index Fund, VBMFX, up 5.67% YTD
The "Marketimer Income Portfolio" has drastically under performed the total bond index and Vanguard's GNMA funds this year.  Of course, safe CDs and Series I Bonds, that I recommend have done the same but they have zero credit or interest rate risk.
I don't like SOME of the funds in Brinker's income portfolio because their returns are correlated to the stock market (they go down when stocks go down) which exactly the opposite of what you want in a "balanced portfolio."   The two funds that have seen returns plunge much like the stock market are loaded with high risk "junk bonds" that do poorly when stocks do poorly.  

I'd rather own stocks with half my balanced portfolio in something like the Total Stock Market (VTSMX) or the S&P500 (VFINX) and get higher returns when stocks go up then keep the other half in something completely safe like CDs and I bonds discussed above.


Learn the "Core and Explore" approach to investing
with "Kirk Lindstrom's Investment Letter"


Subscribe NOW and get the October 2014 Issue for FREE!  


Friday, October 10, 2014

Income Portfolio YTD vs Vanguard GNMA and Total Bond Funds VFIIX & VBMFX

Bob Brinker's Marketimer newsletter has an "Income Portfolio" but Bob Brinker doesn't usually report monthly results for it.  This year the bond market has surprised many with how well it has done despite the fear of the Federal Reserve increasing the Fed Funds short term rates in 2015.

This article is an update of our Sept. 12, 2014 article;
"Bob Brinker's Marketimer Income Portfolio and Radio Advice for Cash"
This graph compares the four funds in the Marketimer Income Portfolio with Vanguard's GNMA fund and the Total Bond index fund.


Fund summary:
  • DLSNX, up 1.46% YTD
  • FFRHX, up 1.31% YTD
  • MWLDX, up 1.48% YTD
  • OSTIX, up 2.13% YTD
With 25% in each at the start of the year, the average is +1.595% YTD.

Compare that to:
  • Vanguard GNMA fund, VFIIX, up 5.57% YTD
  • Vanguard Total Bond Index Fund, VBMFX, up 5.09% YTD
The "Marketimer Income Portfolio" has drastically under performed the total bond index and Vanguard's GNMA funds this year.  Of course, safe CDs and Series I Bonds, that I recommend have done the same but they have zero credit or interest rate risk.

Monday, September 08, 2014

Vodafone's New Mobile Wallet is Apple iPhone 6 Competition

Yesterday's Financial Times of London published an article announcing Vodafone (VOD) and Visa have a new service using near field communication technology (NFC) built into mobile phones to make payments by swiping a phone near a payment terminal.

Vodafone's technology on Android phones will compete with Apple's (AAPL) new iPhones which are expected to have NFC built in for mobile payments linked to their iTunes store.

Vodafone to launch UK mobile payments
September 7, 2014 1:33 pm
Excerpts:
Vodafone will launch a mobile wallet service in the UK next month into a market set to be shaken up by Apple’s plans for a payments platform.

The British mobile group has developed its own service with Visa that will work with a special SIM card embedded with NFC (near field communication) technology that can be used to swipe for payments at contactless tills.

Vodafone is working with third-party loyalty card companies such as Nectar, and will open up the technology to banks to use with their own payment services. The Vodafone wallet can also be used to pay for travel on London Underground, and will allow person-to-person payments between customers.

Vodafone is planning a consumer launch later this year for the service. But it will probably be beaten to the market by Apple, which is expected to integrate mobile payments into its forthcoming range of iPhones, due to be unveiled this week. Vodafone’s mobile application will only be available on Android smartphones.

Click for Current VOD Charts
 Click for Current VOD charts and Quote


Thursday, August 28, 2014

Brinker's Index Fund Advice History

When did Bob Brinker Start Recommending Index Funds?

The Question:  Today I got this question via email from a reader.


Hi Kirk,


...... Appreciate your input on this. You probably have a good idea when Bob Brinker became a fan of index funds.....


Is Bob Brinker's recollection correct on this? I have serious doubts about it.


On last Sunday's Moneytalk, Bob Brinker took a call from Rich in Novato, CA, at the 20 minute mark of the first hour.


Rich read to Brinker what the Wall Street Journal reported about Warren Buffett recommending a portfolio of 90% S&P 500 Index Fund and 10% short term government bonds.


At the very end of the conversation with Rich, Bob Brinker said something that I have serious doubts about

“Going all the way back to the beginning of the Moneytalk broadcast series going all the way back to 1986, I have continuously stated that if I had to choose one fund for stock market investing it would be a low cost total stock market index fund, and low cost funds are available at places like Vanguard and Fidelity that are total stock market index funds with very very low expenses, and I’ve been consistent on that for 29 years”
In the early to mid-1990's and perhaps even much later, Brinker had no index funds in Marketimer.

He was not emphasizing low cost mutual funds, and I specifically remember he once had the PBHG Growth fund in Model Portfolio I, and I believe it had a 2.0% expense ratio (which I think was his limit for an expense ratio).


I distinctly recall a Moneytalk caller asking him about investing in stock index funds, as the caller was interested in investing that way.


Brinker told him "It's not the way I prefer to do it, but if you are going to do it, at least diversify internationally"


During this time frame, I had the distinct impression that Brinker did not like index investing one bit. He focused a tremendous amount of energy and attention trying to pick actively managed stock funds that would beat the market.


I felt that he joined the index investing crowd only when the evidence became overwhelming that actively managed funds as a rule have a very difficult time beating the index funds.


Now he says that since 1986 he's been saying xyz about index funds.


Maybe I'm wrong, and there are many long-term listeners and subscribers out there who can set the record straight.


Would some of the long time listeners and subscribers please chime in and let me know what Bob Brinker's position on index funds was? I don't think he came onboard the index fund bandwagon until very late in the game.


My Answer (In Progress):


I think his reply is "partially true" at best. 

For starters, Vanguard and Fidelity didn't start their total market index funds until the 1990s.    Vanguard was the first and Fidelity came a few years later.
How do you recommend something in 1986 that didn't exist until 1992?


Also, Brinker's newsletter didn't have them as recommended or model portfolio funds in the 1993 Marketimer newsletter.   

Thus, taken literally, Brinker was not being truthful when he said....
“Going all the way back to the beginning of the Moneytalk broadcast series going all the way back to 1986, I have continuously stated that if I had to choose one fund for stock market investing it would be a low cost total stock market index fund, and low cost funds are available at places like Vanguard and Fidelity that are total stock market index funds with very very low expenses, and I’ve been consistent on that for 29 years
Brinker did list the S&P500 and Extended Market index funds from Vanguard in his 1993 recommended fund list so you could construct the total stock market yourself with these funds (as I do in my newsletter core portfolios) if you had guidance on how to allocate your dollars between the two.  

Before you take any of his advice, you must be aware that Brinker is one of the best self promoters ever to grace the radio waves.   I've followed him for over 20 years and his advice and newsletter seems to me (my opinion) to be designed more to use as sample issues than good investment advice.

In his Marketimer newsletter, Bob Brinker has:
  1. Recommended Model Portfolios
  2. Recommended Mutual Funds
  3. Recommended Individual Issues
  4. Recently added "Active Passive Portfolio."
Three Recommended Model Portfolios:  Bob Brinker has model portfolios that he reports performance for. When you see an advertisement for his newsletter, he advertises how well these portfolios have done.  Currently this aggressive and moderate risk portfolios recommend 100% in stocks while his "balanced" Model Portfolio three is two thirds in stocks which is hardly balanced.
This is excerpts from the November 1993 Marketimer.  Note:
  • Portfolio 3 is not balanced
  • He does not compare the performance to index funds or any other benchmarks.
  • The beta is wrong since it applies to the total value in the portfolios and he calculates it based on % listed.
  • There are NO INDEX FUNDS in any model portfolio!


Here are the model portfolios for the last Marketimer published in the 1990s.  Clearly there are no index funds in any of them.  Brinker sold the idea he could pick funds that beat the market.  If you have time, compare how these model portfolios did vs. the market for the periods shown.  Mark Hulbert and several others calculated Brinker greatly under performed the markets during those periods, probably due to the higher expenses of the funds he recommended.  

Also, if you have the time, calculate how "balanced" his model portfolio three was in December 1999 with roughly $39.7K in fixed income (first two funds) and $67.7K in equities while still advertising the fund as "balanced" allocated evenly between fixed income and equities!

Recommended Mutual Funds:  Each issue of Marketimer also has "Bob Brinker's Recommended List of No-Load Funds."  My copy of the November 5, 1993 Marketimer has on
  • Pg. 4: 8 managed funds with expense ratios between 1.00% and 1.84%
  • Pg. 5: 8 managed funds with expense ratios between 1.00% and 1.70%
  • Pg. 6: 6 managed funds with expense ratios between 0.27% and 1.90%
        and 2 Vanguard index funds with expense ratios of 0.20%
I've learned over the years Brinker will often add funds to this list that have done well and are popular AFTER they went up.  I believe he does this so he can say on the radio he has these funds on his recommended list but careful inspection shows he usually doesn't add them to his model portfolios.  Also, when they eventually crash and lose popularity, he'll simple remove them from the list and often not say much about it.  He's done the same for his list of individual issues such as recommending gold via GLD when it was near record highs then deleting it awhile back after gold prices collapsed.

Recommended Individual Issues:  These are individual stocks, ETFs, closed end funds, etc. that he recommends but seldom puts in his model portfolios.  The most famous is the QQQ advice with the recent addition then removal of GLD discussed above.
"Active Passive Portfolio:  Brinker didn't have this in 1993 Marketimer nor was it in the last issue of the 1990s, the December 1999 newsletter.  Here is what he recommended in those issues for model portfolios.

Bottom Line:  Total stock market index funds were not available for purchase in 1986 at either Vanguard or Fidelity.  

Bob Brinker may have had index funds on his list of recommended funds, but index funds were not in his model portfolios or list of individual issues (Not sure ETFs existed back in 1993.)

Brinker can say he's "recommended index funds in his newsletter" since at least 1993 which is as far back as I have issues.  When he sends you a recent sample issue you will see the recently added "Active Passive Portfolio" which you might assume he recommended portfolios with index funds all along which would be a false assumption but one easy to make given what he said on the radio.

If anyone remembers when Brinker first added the active-passive portfolio to Marketimer, please post this in the comments or send me an email.

Check back as I'll probably update this again.

Tuesday, August 19, 2014

Bob Brinker's Model Portfolio III

WARNING!  Bob Brinker's "Balanced" Model Portfolio Three is NOT balanced!

  • A balanced portfolio has half in stocks and half in fixed income that typically goes up when stocks go down
  • Brinker's Model Portfolio 3 is over 2/3rds in stocks!
  • Brinker's Model Portfolio 3 contains "risky" fixed income funds that have a positive correlation to the stock market.  That is the "junk bonds" will typically lose value during a recession when stock prices also fall.

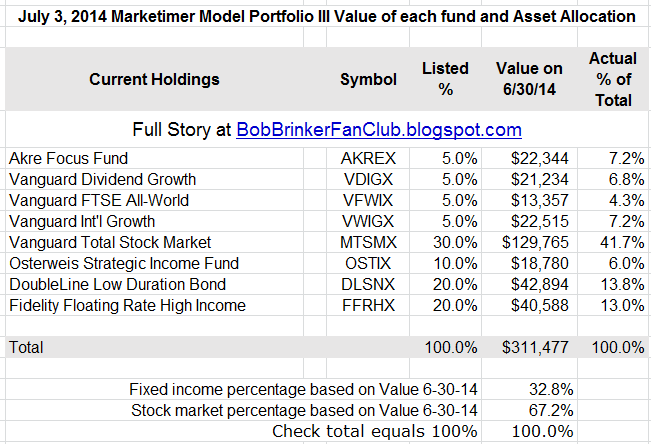
Brinker may show percentages that are 50% in equities and 50% in fixed income and often speaks of how this is to reduce risk during bear markets.  I caution readers that the percentages Brinker recommends are not what he has in these portfolios.  For example, this (repeated below) would lead you to think his "balanced" Model Portfolio III is half in stocks and half in fixed income, but if you look at the dollars he lists each month, he has the portfolio over two thirds in equities, not half!
Here is Bob Brinker's Model Portfolio III, which is a 50% equities/50% fixed income portfolio, "best suited to investors nearing or already enjoying a retirement lifestyle". As of March 4, 2014 Marketimer newsletter:
Akre Focus Fund (AKREX): 5%
Vanguard Dividend Growth (VDIGX): 5%
Vanguard FTSE All-World ex US Index (VFWIX): 5%
Vanguard International Growth (VWIGX): 5%
Vanguard Total Stock Market (VTSMX): 30%
Osterweis Strategic Income Fund (OSTIX): 10%
DoubleLine Low Duration Bond (DLSNX): 20%
Fidelity Floating Rate High Income (FFRHX): 20%
Stock fund vs Bond Funds

Brinker doesn't rebalance his portfolios to 50% stocks.  As a result, when the markets are going up, he can report higher returns than competitors who rebalance.

Here is the composition of Model Portfolio 3 just before the biggest bear market since the great depression:
click images to see full size
Another result that he doesn't talk about is these portfolios give up far more to the downside from their peaks during bear markets.

One of my readers sent me this a few days ago showing the totals for the portfolios and the percentages Brinker shows.  I added a column at the right that calculates the ACTUAL portfolio allocation to each fund. 

That is the portfolios with two thirds in stocks have far more risk than "typical" balanced portfolios like the ones I recommend in my newsletters. See
  •  "Kirk's Two Investment Letters - Which is Best for You?"
    ALL the funds in my core portfolios are at Vanguard but I give ETF substitutions for those who want to use Fidelity, Schwab, etc.... I rebalance about once a year so the costs are tiny and you can avoid those by using the free to trade funds at those fund families, also listed in the newsletter as alternatives.
Another factor is taxes from switching funds, which Brinker does often and I almost never do except for eliminating total bond fund until rates normalize to reduce risk.

Thursday, July 24, 2014

Bob Brinker's Facebook Advice

Bob Brinker was not a big fan of Facebook. 

Joe from Springfield summarized Bob Brinker's July 2012 comments after the Facebook IPO when the stock was below its IPO price. 


Pete, Yesterday when I heard about the good earnings report from Facebook I remembered Brinker commenting on the IPO back on July 12, 2012. Here is what he said:
FACEBOOK IPO FIASCO...Brinker comments: In all of my years in the canyons of Wall Street, I've never seen a bigger debacle than the Facebook initial public offering....Here's a stock that came public a few weeks ago amidst more hype than I've ever seen before.....When I think back to the high profile IPOs of the past, the Apple....even to the Google....I've never seen a bigger fiasco than Facebook. The stock cracked $24 on Friday...It lost over a third of its price in a very short period of time. So in addition to raising the price, the underwriter clowns decide they are going to increase the size of the number of shares they are selling.....Facebook opened at $42 on its way to $24....Facebook has lost $34 billion dollars in market value since its IPO two months ago.....On Friday, when the market was doing very well, Facebook lost another 12%..... 
......The CEO, Mark Zuckerberg, he's a wealthy individual, but Friday, he lost $1.6 billion in stock value....He still has $12 billion in stock....I have no recommendation on this stock. I avoided like the plague on the IPO.....The P/E ratio on Facebook is double the price-earnings ratio on Google....Is that amazing or what? It's more expensive than Yahoo! which has a new CEO.....How much money are they making? They are not making any money. They are losing money. Facebook reported a net loss of $157 million for the quarter they reported on the end of the week.....In the fourth quarter of this year, there will be a release of a huge shares that will become available to the marketplace.
I doubt he will mention the turnaround of this company next Sunday on Moneytalk. Kudos to Zuckerberg.    [Originally posted here.]

I too was worried about the shares coming to market after the lockup.  I circled them in this chart I created in 2012 to get an idea when it would be safe to perhaps buy the company. 
Facebook since its May 18, 2012 IPO @ $38 
Yesterday Facebook reported earnings of $1.44 billion for the first half of 2014.
MENLO PARK, Calif., July 23, 2014 /PRNewswire/ -- Facebook, Inc. (NASDAQ:FB) today reported financial results for the quarter ended June 30, 2014. 
"We had a good second quarter," said Mark Zuckerberg, Facebook founder and CEO. "Our community has continued to grow, and we see a lot of opportunity ahead as we connect the rest of the world."
... 
Income from operations - For the second quarter of 2014, GAAP income from operations was $1.39 billion, up 147% compared to $562 million in the second quarter of 2013. Excluding share-based compensation and related payroll tax expenses, non-GAAP income from operations for the second quarter of 2014 was $1.71 billion, up 116% compared to $794 million for the second quarter of 2013
GAAP is short for "generally accepted accounting principles."

Stock investing is a bet on the future, not the past.  Two years ago, those who bought Facebook shares in anticipation of future earnings are wearing what Bob Brinker calls "watermelon smiles" today.

I thought about buying FB in 2012 to the point I started to track its price on my chart list.    I decided to buy Hewlett Packard (HPQ) instead.  On October 4, 2012 I added HPQ to my newsletter Explore Portfolio at $14.50 and later wrote a free article recommending HPQ on Seeking Alpha when it was still fairly low:
Summary (1/10/13):  I worked at Hewlett-Packard for twenty years as an engineer/scientist in the R&D department starting as a summer intern in 1978. I have not purchased shares since working there and I sold most of them long ago at much higher prices. Now I think it is time to start buying again as there remains much value in the company, even if the mismanagement continues.

I am happy with more than a double for my HPQ plus the dividends it pays but Facebook would have done even better. This chart shows FB is up 200%, the S&P500 is up 34% and HPQ is up 132% (more than a double) since I picked HPQ over the S&P500 (More SPY) and Facebook.  Who knew?


More FB charts & Current Price Quote 

The three portfolios in Kirk Lindstrom's Investment Letter are again at record all time highs.  
Subscribe today and get the July 2014 Issue for FREE!


Tuesday, July 15, 2014

Jim Rogers Investment Advice for Parents

During the 1990s when Jim Rogers was often on TV, Bob Brinker would refer to him as "Mr. Bow Tie" for the fashion statement Rogers continues to make.

In yesterday's article "Jim Rogers reveals his Singapore investment strategy" by Elena Torrijos of Yahoo Finance Singapore, Jim Rogers says parents should:

  1. Educate your kids
  2. buy a home
  3. Have adequate insurance
  4. THEN start investing.
When asked what he believed to be the biggest mistakes he has seen people from Singapore making when investing abroad, he replied:
“They don’t know what they’re doing. That’s the biggest mistake when investing anywhere, but especially overseas. Many people wind up investing in Norway when they can’t find Norway on the map.”

Investors, he said, should know currencies, bonds, governments, taxes and the like – everything, in short. “You have to know all that when investing in your own country, but even doubly when it’s a different country,” he said.
Recent Articles:

SPY 1% Below Record High While ECRI's WLI Is Just Below A 6.3-Year High

  • The latest all-time high for the S&P 500 put it nearly 26% above its 2007 high. The stock market bears who claimed we were in a "Secular Bear Market that began in March 2000" scared many out of the stock market. Those of us who stayed in the markets and added to positions during the downturns are also well above past highs.
Bob Brinker's Last Buying Opportunity

Learn the "Core and Explore" approach to investing
with "Kirk Lindstrom's Investment Letter"
Subscribe NOW and get the July2014 Issue for FREE!   
(Your 1 year, 12 issue subscription will start with next month's issue.)
(More InfoTestimonials & Portfolio Returns)

Monday, May 05, 2014

Bob Brinker's Last Buying Opportunity

Bob Brinker's last "Buying Opportunity" was issued via a bulletin to his subscribers on September 22, 2011.  It read:
September 22, 2011
S&P 500 Index: 1129.56  
In the September edition of Marketimer we continued to recommend a dollar-cost-average on market weakness approach for subscribers looking to add to their stock market holdings. We also stated that in the event an attractive buying opportunity developed between regular monthly investment letter editions, we would post a Special Subscriber Message on the website for subscriber access.  
In our view, the conditions are now in place to justify an upgrade of our stock market view to "attractive for purchase" for subscribers looking for an opportunity to invest new money into the market at attractive prices.  
Following any additional backing and filling that may occur within the vicinity of the recent correction lows, we anticipate that the market will transition into a renewed uptrend based on our corporate earnings outlook into next year. In our view, the S&P 500 Index has the potential to trade into the low-to-mid 1400s range in 2012. 
That was a good time to buy, of course with the markets near record all-time highs, any time in the past has worked out as a great time to buy, even if you bought at the last tops and reinvested dividends.  

With the markets very near their record highs, I can see why he's worried now, but you have to wonder why he missed 1278 and 1353 in 2012 or even a "gift horse buy" at the start of 2013 before the market gained over 32%.

IF you look at a long-term trend chart of the S&P500 on a log scale, you can make a case to say it is about in the middle of its long-term trading range.  Thus my advice is dollar cost average into an appropriate asset allocation for your age.

I can also see why he has remained fully invested since March 2003.  He knows he doesn't add value with his timing.

My advice is ignore all of Brinker's market timing hocus pocus.  If he could really time the stock market, then he
Follow his advice to use low cost index funds then rebalance once a year at a minimum as I recommend in my newsletters.


Learn the "Core and Explore" approach to investing
with "Kirk Lindstrom's Investment Letter"
Subscribe NOW and get the May2014 Issue for FREE!   
(Your 1 year, 12 issue subscription will start with next month's issue.)
(More Info
Testimonials Portfolio Returns)

For conservative investors who have no interest in individual stocks, I co-edit "The Retirement Advisor"  where our most aggressive model portfolio is slightly less aggressive then the "core conservative portfolio" in Kirk Lindstrom's Investment Letter."   For more explanation, see  "Kirk's Two Investment Letters - Which is Best for You?"


Saturday, April 19, 2014

Bob Brinker Sees 1900s for S&P500

With the S&P500 just 1.4% below its all-time closing high at 1864.85, Bob Brinker remains fully invested.  This summary is an enhanced version of what I got from reader via email:
Bob Brinker continues to be constructive on the Equity markets and increased his estimate for the S&P 500 to trade into the low-to-mid 1900’s range going forward
Brinker says the fact the stock market has not experienced a significant correction (10% or more) since the autumn of 2011 cannot be ignored. 
Given the fact that 2014 is a mid-term off-presidential year, Brinker believes’ that the probability of a meaningful correction this year is high. A correction of at least 8% has occurred in every mid-term off-presidential year since 1960. 
Brinker views a correction as a health restoring event for the equity markets.  That means he is not predicting a bear market. 
Brinker is unenthusiastic about adding new money to the stock market at this time.  
Brinker recommends dollar-cost-average purchases to be made on market pullbacks when possible. 
In order to reduce interest rate risk, Bob has replaced all the Bond Funds in his recommended portfolios to lower duration Funds.
It seems Brinker has been weary of this market for a long time. This is what we reported (Feb 24, 2013 Summary) Brinker said in February 2013, over a year ago
Brinker Comment: The stock market indexes are all at or close to their 2013 year-to-date highs and for the most part the highest levels in several years. Those indexes have been strong year-to-date. Having said that, there is a lot of bullish sentiment. A lot of the indicators are showing a lot of bullishness. Usually, at some point, that kind of over-zealous participation is very frequently cause for profit taking. So if you see some profit taking coming into the market, you should not be surprised given the high level of sentiment in a number of indicators.
From a summary of the March 2013 Marketimer posted on the "Bob Brinker Asset Allocation History" we have Brinker also cautious:
"The S&P500 Index has the potential to trade in the mid-1500s range.... The absence of a health restoring correction in 2012 remains a concern"
There you have it.  Brinker has all bases covered.  If the market goes down, he can say he warned it might go down and not to put new money in.  If it keeps going up, as it always does eventually, then he's fully invested and can point to that.
Learn the "Core and Explore" approach to investing
with "Kirk Lindstrom's Investment Letter"
Subscribe NOW and get the The Sept 2014 Issue for FREE!   
(Your 1 year, 12 issue subscription will start with next month's issue.)(More InfoTestimonials Portfolio Returns)

Monday, March 17, 2014

Bob Brinker GNMA Advice

Moneytalk with Bob Brinker Commentary for March 17, 2014 Radio Show

The following commentary is from my "Retirement Advisor" writing partner,  David Korn

Caller: This caller heard Bob saying recently that he thought GNMA’s would take a hit and that he was no longer recommending them.  The caller said she still owns a large position in GNMAs and wanted to know what Bob would do.  

Bob said his recommendation against owning the GNMA fund is based on a risk/reward decision over a long period of time.  Bob said he is recommending shorter duration fixed income securities as part of an overall diversified bond portfolio.  Bob said the average duration he is recommending is about 1 year.  The GNMA fund duration is typically several years.  Bob said he thinks we will eventually see a normalization of interest rates and when that happens you will see the net asset value of the GNMA degrade and given what they are paying it is not worth the risk.


David Korn: The Vanguard GNMA fund (VFIIX) that Bob recommended for so many years is actually up 2.48% year-to-date, not too shabby at all. It has a current yield of 2.80% and its shares closed Friday at $10.62.
See my article:
Monday, July 15, 2013: Bob Brinker Fan Club:
Sell GNMA to Buy Fidelity Floating Rate Income Fund, Good or Bad Advice? 


FREE==> SAMPLE Issue  <== FREE

More information:

The above commentary is courtesy of my writing partner, David Korn
David Korn's Stock Market Commentary, Interpretation of Moneytalk (Bob Brinker Host), Financial Education, Helpful Links, Guest Editorials, and Special Alert E-Mail Service.  Copyright David Korn, L.L.C. 2012
 If you would like a free sample of David's complete "Brinker related newsletter" and his "Retirement Advisor" newsletter, then click this link to send an email request and please tell us a bit about yourself too.

Friday, January 31, 2014

Bob Brinker, Jim Cramer & John Bogle: Trending Financial Advisors

Interest, on a relative basis, in Bob Brinker has steadily fallen over the past decade. It is interesting to compare interest in Brinker to others like Jim Cramer and John Bogle.

Bob Brinker
  • 2004:  Interest level was 100
  • 2014: Relative interest level is 9, down 91% in a decade. 


Jim Cramer   


Interest in Brinker and Cramer has fallen as I believe people realize they make more noise tooting their horns than actually helping people make money.

While interest in both Brinker and Cramer has fallen, Cramer received far more overall interest on Google over the last decade:


This shows interest in John "Jack" Bogle, founder of Vanguard group which I use to construct my core newsletter (Subscribe) portfolios, is down also.

John "Jack" Bogle
  • 2004:  Interest level was 100
  • 2014: Relative interest level is 40, down 60% 


Mark Cuban


Mark Zuckerberg


Snapshot for Jan 2004 to Jan 2014

When I used to run the "Investing and Personal Finance" section of Suite101 back in 2000, interest by the general public in investment topics was at a peak.  I remember my one topic about Bob Brinker would get more hits in a single day than this blog gets in a whole month. 

This general lack of interest is good news for contrarians.

Don't Miss Out!
Subscribe To my newsletter today
and get the January 2014 issue for free
(Start subscription with February issue)


FREE Updates Mailing List


We email regular "FREE Bob Brinker Fan Club Updates" to everyone on our "Bob Brinker Fan Club" distribution list. If you would like to get on this list, then click this link.


Top Rated Newsletter


Timer Digest Features
Kirk Lindstrom's Investment Letter
on its Cover

Cick to read the full page article!


US Treasury Rates at a Glance - iBond Rates - LIBOR Rates

Must Read:
Beware of Annuities - Payday Loans Warning