Search Bob Brinker Fan Club Blogs

Tuesday, December 31, 2019

2019 Final Results

What a great year 2019 was for the stock market!

I was bullish for 2019 but I sure didn't "expect" the markets to gain over 20%


Ask about my special to subscribe and get the current month's issue for free.
Don't miss out!Subscribe NOW !

Update 1/3/2020


update 2/4/2020


Thursday, September 12, 2019

Record Highs, Market Sentiment Update and Market Timer of the Year Race

Yesterday my Newsletter Explore Portfolio and my own personal portfolio closed at record highs.  
Market Data for 9/11/19
Market Update - Closing Statistics More Market Charts & Data
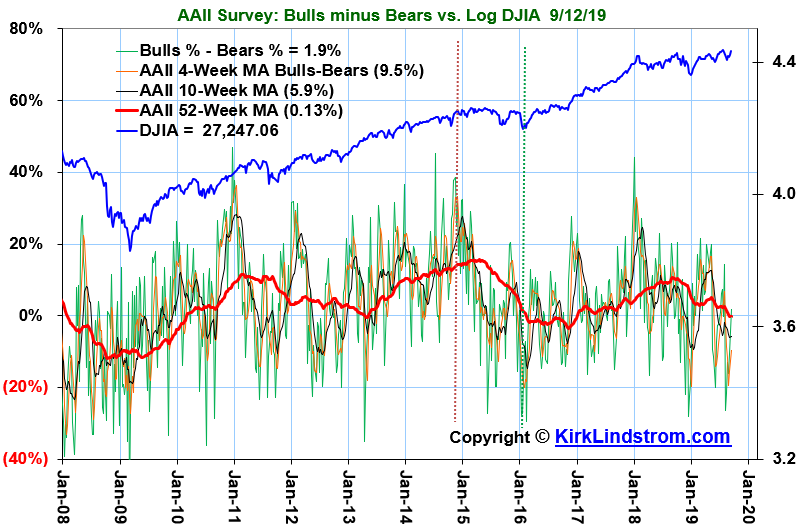
Despite the markets being close to record highs, investor sentiment is not as bullish as one might think.  Below are some of the sentiment charts I follow.

The "pros" in the II graph are more bullish than individual investors in the AAII graph with the number of bullish individual investors back above the number of bullish investors.


II Bulls-Bears Sentiment Graph - Log Scale

AAII Survey: Bulls minus Bears vs. Log DJIA


Kirk Lindstrom's Investment Letter
Don't miss out!
 Subscribe NOW

and get the September 2019 Issue For Free!

TD: Timer Digest ST (1-yr) Bulls - Bears vs. S&P 500  

TD: Timer Digest Gold Bulls - Bears vs. GLD 

Put Call Ratio ($CPC)

TD Timer of the Year Race
(I'm tied for second for 2019!)


Let me know if you have any other favorite charts of mine you'd like to see on a regular basis.

Never Forget 9/11/01


Kirk Lindstrom's Investment Letter
Don't miss out!
 Subscribe NOW

and get the September 2019 Issue For Free!
(Mention you read this offer here)

Saturday, February 23, 2019

Bull Market Update - New Record High!

Weekend Market Update

After spending a short time down over 20% making a "Christmas Bottom" for the bear market, when it was a great time to buy (See Buy Alerts below) all major US markets are now out of the bear, out of the "10% correction zone" and nearing new highs again.


As of Feb. 23, 2019 I have a new RECORD high in my newsletter "Explore Portfolio" while the S&P 500 broke above its 200-day moving average but remains about 5% off its high. 


This last chart shows the markets vs the Fed Funds rate back to the mid 1990s.


 Subscribe NOW  and get
the
 March 2019 
Issue for FREE!!!
Recent articles:


Discuss this article on my "Investing for the Long Term" Facebook Group

FREE Updates Mailing List


We email regular "FREE Bob Brinker Fan Club Updates" to everyone on our "Bob Brinker Fan Club" distribution list. If you would like to get on this list, then click this link.


Top Rated Newsletter


Timer Digest Features
Kirk Lindstrom's Investment Letter
on its Cover

Cick to read the full page article!


US Treasury Rates at a Glance - iBond Rates - LIBOR Rates

Must Read:
Beware of Annuities - Payday Loans Warning