 One of Bob Brinker's key "sentiment indicators" is the Investors' Intellegence survey data of Bulls minus Bears. One of the oldest weekly sentiment indicators is the “Investors Intelligence Survey“ or IIS. The IIS began in January 1963 by A.W. Cohen and has been published every week ever since. Graphs of the Investors' Intellegence survey data of Bulls minus Bears versus the market are key sentiment indicators for stock market technical analysis.
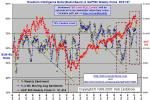
I have been charting this data since 1998. A spike on my charts of "Investors' Intelligence (II) Bull Bear Survey data" is lower than the March 2003 spike and about equal to the July 2006 spike. ALL spikes this low or lower led to significant rallies of several months or more, including the spike in 2001 and the 20% correction in 1998.
I just updated the charts for "II vs DIJA" and "II vs S&P500" at Investors' Intelligence Sentiment Indicator where I have graphs of the bulls over bulls minus bears and the four week moving average of that data charted back to 1998.
Visit our Facebook Sentiment Forum at "Investing for the Long Term" to ask questions or discuss the data.


