Search Bob Brinker Fan Club Blogs

Showing posts with label sentiment. Show all posts

Thursday, November 02, 2023

AAII and II Sentiment Update

  🐂📈Kirk Lindstrom's Investor Bull/Bear Sentiment Charts for 11/2/23 📉🐻

Bob Brinker was the first radio host I knew who spoke of applying contrarian theory to investor sentiment.  There is an old Wall Street adage, "Buy when there is blood in the streets" but Brinker gets kudos for bringing this theory to the small, individual investor. 
Reminder, you can follow this feed (subscribe for free) and get sent emails by Google when I post new charts and articles here. Just click "Follow" below.
11/2/23 Notes:
  • There is a large divergence between professional newsletter writers (II) and individual investors (AAII) sentiment.
  • II is "neutral" but its decline is large enough to support another rally.
  • AAII below negative 20% is bullish for contrarians
II Investors Intelligence & AAII (American Association of Individual Investors) Sentiment Updates.
Graphs below best viewed in full screen mode.

II Bulls and Bears Sentiment Graphs


AAII Bulls and Bears Sentiment Graphs: The AAII Investor Sentiment Survey measures the percentage of individual investors who are bullish, bearish, and neutral on the stock market for the next six months.

These charts are covered on page 6 of my newsletter with updates during the year for what the different types of sentiment charts mean to me. This is an easy place to give my subscribers updates of charts too numerous to add each month I cover.


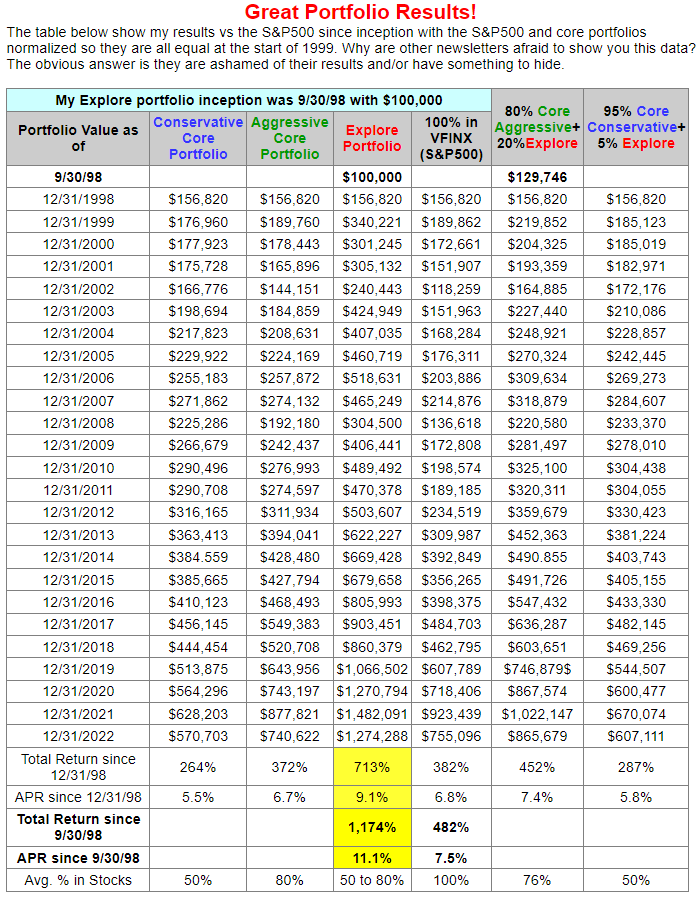
To see what stocks and ETFs are in my "Explore Portfolio" and get a full list of on my price targets to both take profits or buy more:

 Subscribe NOW  and get
the
 November 2023 
Issue for FREE!!
(If you mention this ad)


Thursday, September 12, 2019

Record Highs, Market Sentiment Update and Market Timer of the Year Race

Yesterday my Newsletter Explore Portfolio and my own personal portfolio closed at record highs.  
Market Data for 9/11/19
Market Update - Closing Statistics More Market Charts & Data
Despite the markets being close to record highs, investor sentiment is not as bullish as one might think.  Below are some of the sentiment charts I follow.

The "pros" in the II graph are more bullish than individual investors in the AAII graph with the number of bullish individual investors back above the number of bullish investors.


II Bulls-Bears Sentiment Graph - Log Scale

AAII Survey: Bulls minus Bears vs. Log DJIA


Kirk Lindstrom's Investment Letter
Don't miss out!
 Subscribe NOW

and get the September 2019 Issue For Free!

TD: Timer Digest ST (1-yr) Bulls - Bears vs. S&P 500  

TD: Timer Digest Gold Bulls - Bears vs. GLD 

Put Call Ratio ($CPC)

TD Timer of the Year Race
(I'm tied for second for 2019!)


Let me know if you have any other favorite charts of mine you'd like to see on a regular basis.

Never Forget 9/11/01


Kirk Lindstrom's Investment Letter
Don't miss out!
 Subscribe NOW

and get the September 2019 Issue For Free!
(Mention you read this offer here)

Friday, October 26, 2018

Stock Market Update After Major Sell-off - Buying & Selling Opportunities

What a month for the bears!  All indexes but the Nasdaq are down for the year.

Hopefully you took some cash out of the markets near the highs to use to buy near the lows.


Keep checking back as I add sentiment charts over the weekend.

Here is a look at the markets on a closing basis.  All are down between 8.0% and 14.8% from their peak values!
Markets at a Glance courtesy of WSJ

Here are the markets showing intraday values.  With high speed computer trading, I believe intraday values are far more important than closing values.  One reason is you can have a major reversal during a day when markets hit resistance points like their 50 and 200 day moving averages or round numbers like $25 or "down 20% from a peak."
 

Hopefully you took some profits when the markets were up so you can take advantage now that they are much lower and the level of fear is intense!


This "Fear and Greed vs. the S&P 500 Sentiment Chart" shows now is a good time to be putting some cash back to work.

This are some of the "sell alerts" I sent my newsletter subscribers near the top.

This is one of my recent "buy alerts" I sent my newsletter subscribers this week.

As Bob Brinker used to say 20 years ago in his younger days "Intel is a great trading stock."

Click "Follow" to get email updates or subscribe to my newsletter to get the most important announcements and investment information. 


 Subscribe NOW  and get
the
 October 2018 
Issue for FREE!!!
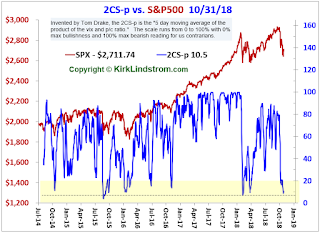
Nov. 1, 2018 Update 
2CS-p Sentiment Indicator
More about 2CS 


Keep checking back as I add more charts over the weekend.
Send me an email if you have any chart requests
...

Wednesday, February 13, 2008

Bearish Investors' Intelligence Survey Data Good For Us Contrarians

One of Bob Brinker's key "sentiment indicators" is the Investors' Intellegence survey data of Bulls minus Bears. One of the oldest weekly sentiment indicators is the “Investors Intelligence Survey“ or IIS. The IIS began in January 1963 by A.W. Cohen and has been published every week ever since. Graphs of the Investors' Intellegence survey data of Bulls minus Bears versus the market are key sentiment indicators for stock market technical analysis.

I have been charting this data since 1998. A spike on my charts of "Investors' Intelligence (II) Bull Bear Survey data" is lower than the March 2003 spike and about equal to the July 2006 spike. ALL spikes this low or lower led to significant rallies of several months or more, including the spike in 2001 and the 20% correction in 1998.

I just updated the charts for "II vs DIJA" and "II vs S&P500" at Investors' Intelligence Sentiment Indicator where I have graphs of the bulls over bulls minus bears and the four week moving average of that data charted back to 1998.

Visit our Facebook Sentiment Forum at "Investing for the Long Term" to ask questions or discuss the data.


drugstore.com, inc.

drugstore.com, inc.

Saturday, September 08, 2007

10-day and 60-day Put Call Ratio at Record Highs!

In his September Marketimer, Bob Brinker wrote very highly of the "extraordinary" high levels for the 10-day and 60-day moving average of the CBOE put/call ratio.

Click graph to view full sized


The CBOE (Chicago Board Options Exchange) Put/Call Ratio (CPC) is the ratio of the trading volume of put options to call options. Bearish investors buy put options that gain in value when the market goes down. Bullish investors buy call options that gain in value when the market goes up. A high put/call ratio is bullish for us contrarian investors.

I track the 10-day and 66-day moving averages of the put call ratio. 66 days is three months. As the graph shows, the 66-day and 60-day moving averages are nearly identical and both are at record high levels. This is GREAT NEWS for us bulls!!!

  • Get my newsletter with its buy and sell levels for my explore stocks I feel are ready to explode TODAY!
  • Subscribe NOW with a credit card and be ready for Monday's market open!!!

FREE Updates Mailing List


We email regular "FREE Bob Brinker Fan Club Updates" to everyone on our "Bob Brinker Fan Club" distribution list. If you would like to get on this list, then click this link.


Top Rated Newsletter


Timer Digest Features
Kirk Lindstrom's Investment Letter
on its Cover

Cick to read the full page article!


US Treasury Rates at a Glance - iBond Rates - LIBOR Rates

Must Read:
Beware of Annuities - Payday Loans Warning