Search Bob Brinker Fan Club Blogs

Friday, October 24, 2014

Did You Buy on the 10% Correction Weakness?

For several years Moneytalk host Bob Brinker has said he likes to dollar cost average on weakness with new money.  By my eyes, this chart shows the market corrected by 10% and many stepped in to buy which caused the market to soar.

Note too that this correction touched my dashed green support line and the depth of the correction was the "best weakness" the market has seen going back to 2012!

Intraday "Correction" Statistics for 10/24/14
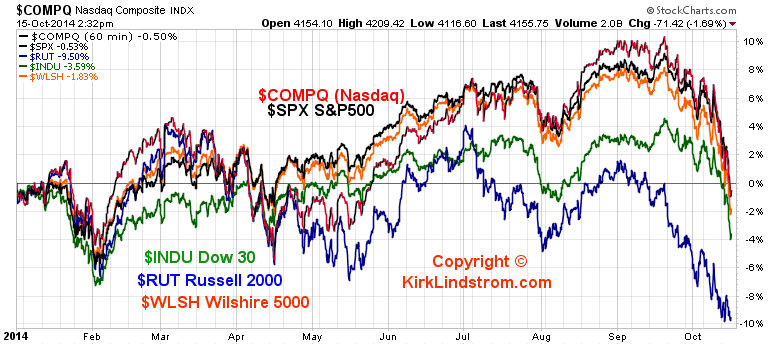
See S&P500 Chart
  • Last Market High 09/19/14 at 2,019.26
  • Last Market low 10/15/14 at 1,820.66
  • Current S&P500 Price 1,964.58
  • Decline in Points = 54.68
  • Decline in percent = 2.7%
  • Max Decline = 9.8%
=>This means the decline from intraday high to intraday low is 9.8% and we are currently only 2.7% the all-time record high.

On October 13, I posted this FREE blog article:

On October 15, I posted this FREE blog article:
Did you do any buying on the recent 10% weakness?

I did!  I also sent email alerts to my newsletter subscribers announcing we reached some of my buy targets published in my September newsletter as a reminder.

For more market data, see:


No comments:

Post a Comment

Note: Only a member of this blog may post a comment.

FREE Updates Mailing List


We email regular "FREE Bob Brinker Fan Club Updates" to everyone on our "Bob Brinker Fan Club" distribution list. If you would like to get on this list, then click this link.


Top Rated Newsletter


Timer Digest Features
Kirk Lindstrom's Investment Letter
on its Cover

Cick to read the full page article!


US Treasury Rates at a Glance - iBond Rates - LIBOR Rates

Must Read:
Beware of Annuities - Payday Loans Warning