Search Bob Brinker Fan Club Blogs

Showing posts with label Cash Reserves. Show all posts

Sunday, May 14, 2017

Bob Brinker's Market Outlook, Advice for New Money & More

Bob Brinker Market Update for May 2017.  In this issue I discuss:
  • Bob Brinker's May 2017 Market Outlook.
  • Marketimer Allocations
  • Is Brinker more or less bullish than in past years at this time?
  • Series I-Bonds
  • Advice for new money.
  • GNMAs
  • Timer Digest Update
  • Link to Listen Live (1-4PM PST, 4-7PM EST)
Bob Brinker's May 2017 Market Outlook.  In his May 2017 Marketimer newsletter, 
  • As of May 3, 2017 with the S&P500 at $2,384.20, Bob Brinker is bullish and fully invested.
  • He expects the S&P500 to earn $130 in 2017 and says it can support a P/E ratio of 17 to 18 times that.
  • Bob says the market can "trade well into the S&P 500 Index 2400s range going forward."
  • We're nearly there already given the market has traded into the 2400s already this month!
  • Bob also says "tax reform legislation" going forward could lead to "a healthy increase in operating earnings in 2018."  This is pretty much what every talking head on CNBC from both political parties says would happen if companies get to keep more of the money they earn.
Marketimer Allocations:
  • Model Portfolio's one and two are 100% in stock funds with 80% in the US and 20% as the listed percentage in an "All-World" index fund.  
  • The actual percentages in his portfolios vary from what is listed since he doesn't rebalance or update the percentages often.   
  • It seems odd he offers zero guidance for using the percentage he recommends or the actual percentage in the portfolios he shows and reports measured performance for.  For example, he recommends 30% in VTSMX for P3, but the actual percentage is 33.5%, over 10% more than he recommends!
  • Model Portfolio three is listed as 50% in stocks but since he doesn't rebalance often, he has quite a bit more in stocks than fixed income.  Of the stocks, he has about 20% of that in the same "All-World" index fund.  (so 10% "All-World" and 40% US)
  • His "Active/Passive Portfolio" is 100% in stocks with the same 80:20 balance between US and foreign
  • His "Income Portfolio" is 100% out of stocks with money spread between three managed funds with duration between 1.25 to 1.52 years and yield between 1.95% and 4.62%
May 13, 2017 Market Update - Summary

  • The four major US markets I follow are up between 1.9% and 13.7% YTD.
  • The S&P500 and Nasdaq markets set new record closing highs this week.
  • The 2400 level continues to be strong resistance for the S&P500 while open gaps are cause for concern.
  • The New Rates for New and Old I-Bonds are out.
  • My Explore Portfolio continues to do well in 2017 after a great 2016.  It finished the week at a new record high!
  • Full Article: Markets Near Record Highs, Open Gaps & 2400 Resistance Level


I plan to add to and finish this article over the next few days so come back and look for more.


Kirk Lindstrom's Investment Letter:
Subscribe NOW & get the May 2017 Issue for FREE!!!


Make sure you read:


Monday, December 13, 2010

Bob Brinker's Vanguard GNMA Fund (VFIIX) Advice

Vanguard GNMA + Cash Reserves Advice
Vanguard's web site says their GNMA fund (VFIIX quote & Charts) will go "ex dividend" on Dec. 29 with a 23¢ payout. If you are using "Bob Brinker's GNMA Advice to use a Stop Loss" to protect yourself from high net asset value loss, then you should reduce your stop price to account for this distribution.


As many regular readers if this blog know, I sold my GNMA fund awhile ago and bought TIPS and iBonds. I also sold all my bond funds not indexed to inflation. I put the remainder of my "fixed income money" in short term savings accounts that earn 1% or more. I have no reason to take bond fund risk until the Federal Reserve "normalizes" interest rates.

Some people need the income but I tell my subscribers there is a better alternative. I recommend selling SOME of your appreciated stocks or funds when you do your annual rebalance then use some of the profit taking cash for spending over the next year. Put the money into a savings account to use during the year to replace the income from bond interest and dividends. My explore portfolio is up 17.9% YTD so I've already taken significant profits.

I currently have the bulk of my fixed income cash at HSBC Bank and StarOne Credit Union. They both just dropped rates so I am leaning towards moving some of the money to American Express for 1.30%. For details, click "Learn More" here. If you hear of a large bank paying a better rate for short term savings, send me an email with the details.

Fixed Income Advice

This is what I sent my newsletter subscribers earlier today:
Hello Subscribers

I moved my explore portfolio cash reserves from Schwab, where I was earning 0.25%, to American Express Bank where they are paying 1.30% APY.

If you have significant funds in a retirement account at Vanguard's prime money fund and don't want to move to another institution, then  I suggest making a ladder of CDs with Vanguard's CD Ladder tool.  Divide the funds into 5 buckets. Keep 1 bucket (20%) in Prime money fund ready for any buying opportunities or potential rebalancing, then put the remaining 80% into CDs for 3, 6, 9 and 12 months.  As the 3,6 and 9 month CDs mature, buy a new 1-YR CD.  After 9 months, you will have four one year CDs with one maturing every quarter.  When interest rates normalize, you can put the CD funds into the total bond fund again.

You can get an idea what different banks are paying for CDs and savings accounts for various amounts by using the rate tool here.  I use American Express because it is available to everyone and it is "too big to fail."  You can often find better deals with more restrictions such as the 1.3% at Capital One plus 10% bonus and up to $60 credit detailed here, but you have to be a member of Costco.

For reporting simplicity, I have enough to calculate already, I will keep my core portfolios fixed income in Vanguard's prime money fund knowing it is a slight drag on my reported performance compared to the above CD ladder strategy.
The difference between 1.30% at American Express and 0.06% at Vanguard is $1,240 per $100,000.  Thus it is worth the trouble if you have significant money in fixed income you don't want exposed to rising rates in the bond market.

2010 YTD my "Explore Portfolio" is up 18.7% YTD
(My explore portfolio has 70% in equities and 30% in fixed income so the stocks are doing very, very well)
Subscribe NOW  
and get the This Month's Issue for FREE! !
Your 1 year, 12 issue subscription will start with next month's issue.

Since 12/31/98 "Kirk's Newsletter Explore Portfolio" is UP 208%  vs. the S&P500 UP only 23% vs. NASDAQ  UP a only 20%   (All through 12/13/10)  

In 2009, "Kirk's Newsletter Explore Portfolio" gained 33.5% vs. the DJIA up 18.8%

FREE Updates Mailing List


We email regular "FREE Bob Brinker Fan Club Updates" to everyone on our "Bob Brinker Fan Club" distribution list. If you would like to get on this list, then click this link.


Top Rated Newsletter


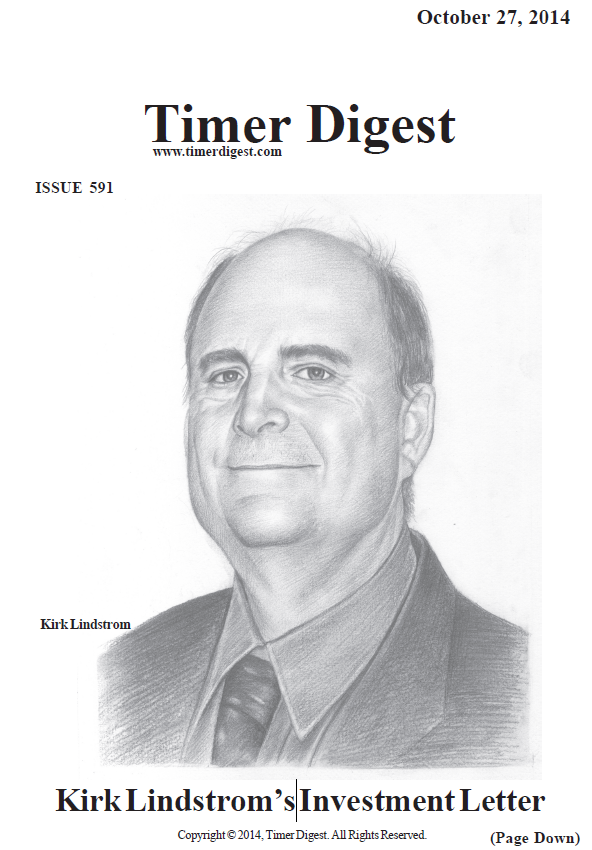
Timer Digest Features
Kirk Lindstrom's Investment Letter
on its Cover

Cick to read the full page article!


US Treasury Rates at a Glance - iBond Rates - LIBOR Rates

Must Read:
Beware of Annuities - Payday Loans Warning