Search Bob Brinker Fan Club Blogs

Showing posts with label Best Investment Newsletter. Show all posts

Saturday, June 24, 2023

Bob Brinker Closing Marketimer Newsletter

 Here is a copy of an email forwarded by a friend and subscriber to my newsletter. 

A friend forwarded this to me, thought you might be interested.  I know you’re no fanboy, but still, goes way back.

Received this in today's mail:

"Due to personal reasons, the Marketimer Investment Letter is closing.  The June 2023 edition was our final issue.

Enclosed is a refund for the remaining balance of your subscription.

Thank you for your support over the last four decades."

Hopefully Bob is well and wants to spend his twilight years with his family in full retirement. 

After missing yet another bear market last year leading to 15-years of underperformance, he may not have had enough subscribers to pay the bills for a newsletter that came in the mail.


If you are looking for a "more modern" newsletter that covers stocks, ETFs, fixed income and Bonds, then give Kirk Lindstrom's Investment Letter a try. 


To see what stocks, ETFs and fixed income investments are in my "Explore Portfolio" and get a full list of on my price targets to take profits or buy more:
 Subscribe NOW  and get
the
 June 2023 
Issue for FREE!!
(If you mention this ad)
More about Series I Bonds


Wednesday, May 31, 2023

Market Update for March 31, 2023


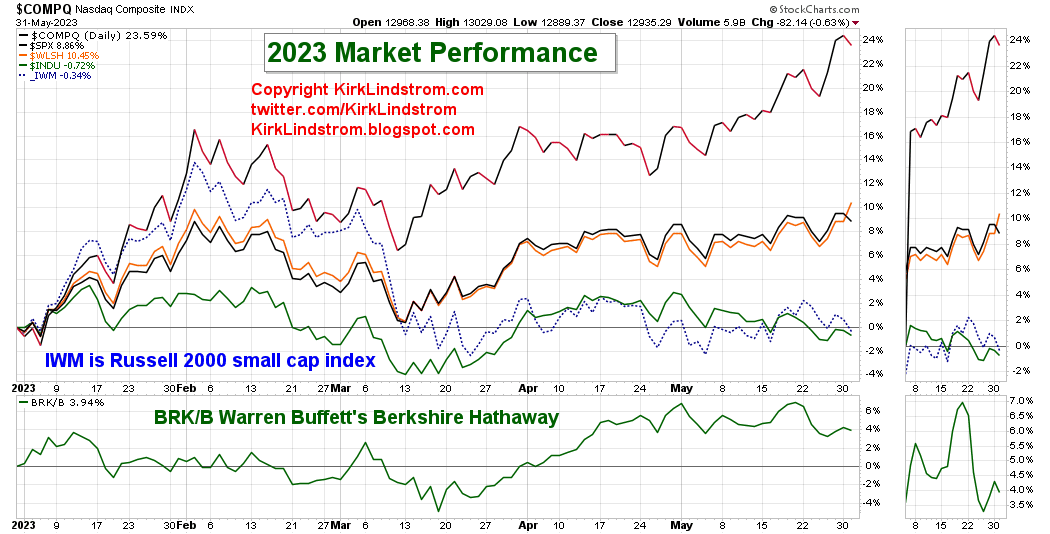
💲Market Update for March 31, 2023💵

Five of twelve months into 2023, we have a split market with the Dow and the Russell 2000 indexes down 🐻📉while the S&P 500 and the Nasdaq indexes are up🐂📈.
All four market indexes remain down double digits from their ATHs (All Time Highs) also summarized in the same table.


S&P 500 Stocks YTD Heat Map where the size of the boxes represents the market capitalization (share price times shares outstanding) .  Meta, AKA Facebook, more than doubled during the first five months of 2023.
My Results YTD are Impressive if I may say so myself...
  • I'm roughly matching SPY YTD with only 57% in the markets AND I'm only 6.6% below my record high!
  • My Explore Portfolio stocks on their own are up roughly 15.8% YTD!
  • Over the long term, I've smashed the index which very, very few have done.
The best news, that my long-term subscribers are well aware of, is my mix of stocks (as opposed to Warren Buffets for example) are generally leading market indicators. That is they start going up early in bull markets, probably because they are mostly "picks and shovels" companies. Likewise, they start to go down while everyone else thinks the markets should keep going higher. Knowing this helps me improve my overall returns by being more or less aggressive buying dips or taking profits depending on where we are in the cycle.
To see what stocks and ETFs are in my "Explore Portfolio" and get a full list of on my price targets to both take profits or buy more:
 Subscribe NOW  and get
the
 May 2023 
Issue for FREE!!
(If you mention this ad)
Dow vs Oscillators
These wide images are best views in full screen


Sunday, January 07, 2018

Market Timer of the Year Awards

The 2017 Market Timer of the Year Award is out and "Kirk Lindstrom's Investment Letter" Tied for 1st Place!


For the Long Term Timer of the Year, "Kirk Lindstrom's Investment Letter" Tied for 2nd Place!


Kirk Lindstrom's Investment Letter
(My SPECIAL ALERT emails will begin as soon as I get payment via check or PayPal)


Monday, August 14, 2017

Bob Brinker's Market Outlook and Advice for New Money

Bob Brinker Market Update for August 2017.  In this issue I discuss:
  1. Bob Brinker's August 2017 Market Outlook.
  2. Marketimer Allocations
  3. Advice for new money.
  4. Series I-Bonds
  5. Timer Digest Update
  6. Link to Listen Live on internet radio
  7. Newsletter Special Offer - August Issue for Free!
#1 Bob Brinker's August 2017 Market Outlook In his August 2017 Marketimer newsletter, Brinker remains bullish on the US stock market.  In the first two pages, he covers his "primary" causes for a bear market.  I guess he changed the name from "five root causes of a bear market" after they completely missed the last bear market where the S&P 500 fell over 50% while Brinker issued "buy alerts" all the way down to the 800s then stopped before the actual bottom in the 600s. Why would he change the name?  Easy, "Google Search."  As such, I take his timing with a grain of salt.  With that said, Brinker:
  • says you can get a PE of 17 to 18 times earnings 
  • projects the S&P 500 earnings will be $140 in 2018
  • thus the market has a "potential" for mid-2500s "going forward."
    [18 x $140 = $2,520]
  • At the time of publication, the S&P500 was $2470.30 so $2534 (the lower end of mid $2500s or $2534 to $2567) is only a gain of 2.6%.  Thus, he's not going out on a very big limb with that projection.
#2 Bob Brinker's Marketimer Allocations:   
  • Model Portfolio's one and two are 100% in stock funds 
  • Model Portfolio three is listed as 50% in stocks but I calculate he has 56% in stocks which means he's more bullish than "balanced."
#3 Bob Brinker's Advice for New Money:   
  • Bob continues to recommend a "dollar-cost-average approach, especially during periods of market weakness" but gives no guidance on what he considers weakness or why not just do a typical dollar-cost-average no matter what the market does.  This waiting for "weakness" has kept a good number of individual investors on the sidelines missing this great opportunity to make a lot of money!
#4 Series I-Bonds
  • Bob didn't mention Series-I US Savings bonds in the latest Marketimer but he has talked about them in the past on his radio show, Moneytalk
  • I have iBonds in my "Explore Portfolio" of "Kirk Lindstrom's Investment Letter."  I think iBonds are a good, conservative investment that will keep pace with inflation and defer taxes thus they are great for taxable savings when you are in a high bracket.
  • Read more at:  Current Series I Bond Rates  and  Historical Series I Bond Rates
#5 Timer Digest Update
  • Here is an update from the August 9, 2017 Timer Digest Hotline.  (Bob Brinker isn't mentioned but I am in the top 10.)
  • Last week I added to GE (charts) at $25 and change.  I last took profits in GE last year at $32.50.  It may go lower, but I like the juicy yield here and I have more buy targets in my newsletter to get more shares as I "dollar cost average" back into stocks after I take profits at higher levels.  Send for a free sample issue if you wish to learn more how I do this.
  • Here is an update from the August 7, 2017 Timer Digest Newsletter.  Bob Brinker isn't mentioned but I am in the top 10 for 1-year and I am tied for first place in "Long-Term" timing.
  • Get a Free Issue of Timer Digest here

#6 Click to Listen Live at KFNN from 1-4PM PST, 4-7PM EST

#7 Newsletter Special Offer 
  • Subscribe NOW and get my August 2017 Issue for Free!
  • Your 1 year, 12 issue subscription will start with next month's issue.
  • Get email alerts when I buy or sell securities for my explore portfolio. My "Auto Buy" and "Auto Sell" levels are set ahead of time for target buy and sell levels for my securities.  This allows you to place "limit orders" with your broker in advance so you can go about your business.
  • Unlike "others," I will answer All questions about what I write by Email.  If what I write is not clear to you, just ask! 


Sunday, November 15, 2009

Kirk's Two Investment Letters

There may be some confusion because I write two different, but related, newsletters.

#1 "Kirk Lindstrom's Investment Letter" is $155 a year and uses the "core and explore" method to invest. It has two core portfolios plus an explore portfolio of individual stocks. My aggressive core portfolio has 80% equities while my "conservative" core portfolio has 50% in equities. My core portfolios are made of index funds and ETFs for the very lowest expenses.

I recommend people start by getting their proper core portfolio created THEN add individual stocks I cover in my explore portfolio to build your own explore portfolio for 5 to 20% of your investment portfolio total. I have target prices to buy and sell my explore stocks so I find I almost look forward to market declines to get really great prices for stocks I can sell later at higher prices. Of course, following this explore portfolio is more work than buying index funds and rebalancing once a year that I recommend for my core portfolios. Compared to "other newsletters" costing more, my core portfolios and general stock market coverage in the first 11 pages of the 35 page monthly letter offer significant value even for those who don't dabble in individual stocks.

#2 I write "The Retirement Advisor" with David Korn. We sell this for a very modest $99. We offer three model portfolios. We do not recommend individual stocks but we have articles that discuss current financial events such as economic data and Social Security COLAs. We also have articles to help you save money plus we find CDs with FDIC paying the highest rates. Our most aggressive portfolio has 50% in equities. Our most conservative portfolio contains no equity exposure.

Difference: The conservative (50:50) core portfolio in "Kirk Lindstrom's Investment Letter" is slightly more aggressive than the aggressive model portfolio #1 in "The Retirement Advisor." Over the very long term, you should expect the most aggressive portfolio to have the highest returns but at a price of higher volatility. When we started the "The Retirement Advisor" in 2007 we thought people like Bob Brinker were far too aggressive with equity exposure recommendations for retired people at such a risky time for the markets. If you recall, Brinker's Model Portfolio #3 was nearly 2/3rds in equities when the markets peaked. As our great returns show, we were right.
____

From 1/1/1999 Through 11/15/09
Kirk's 80:20 Aggressive Core Portfolio is up 50.8%
Kirk's 50:50 Conservative Core Portfolio is up 67.3%
Kirk's 70:30 Explore Portfolio is up 146.1%
80% Core Aggressive plus 20% Explore is up 69.8%
90% Core Conservative plus 10% Explore is up 75.1%

100% Total Stock Market (VTSMX) is up 18.2%
100% Total Bond Market (VBMFX) is up 78.2%
80% VTSMX and 20% VBMFX is up 30.2%
50% VTSMX and 50% VBMFX is up 48.2%
YTD through 11/15/09
Kirk's 80:20 Aggressive Core Portfolio is up 23.0%
Kirk's 50:50 Conservative Core Portfolio is up 16.4%
Kirk's typically 70:30 Explore Portfolio is up 26.7%

100% in VTSMX is up 25.1%
100% in VFINX (S&P500) is up 23.7%
100% in VBMFX (Total Bond) is up 6.6%
80% VTSMX and 20% VBMFX is up 21.4%
50% VTSMX and 50% VBMFX is up 15.9%
12/8/09 update:

As of December 8, 2009, "Kirk's Newsletter Explore Portfolio" is up 32.5% YTD vs. DJIA up 17.2% YTD

"Kirk Lindstrom's Investment Letter"
HURRY! Subscribe NOW and get the December 2009 Issue for FREE! !
(Your 1 year, 12 issue subscription will start with next month's issue.)
____

The Retirement Advisor Model Portfolios all began with $200,000 on 1/1/2007

The Retirement Advisor Portfolios Dollar Value on 10/31/09 Change
Model Portfolio 1 $205,877 2.9%
Model Portfolio 2 $218,720 9.4%
Model Portfolio 3 $237,182 18.6%
DJIA 12,501.52 on 1/1/2007 $9,712 (24.0%)
S&P500 1,418.30 on 1/1/2007 $1,057.08 (28.0%)
FREE SAMPLE issue of The Retirement Advisor newsletter in pdf

Website for more information and our annual Performance Data

Sunday, May 10, 2009

Best Investment Newsletter

2009 Year-To-Date (through April 30, 2009)
"Kirk's Newsletter Explore Portfolio" is UP 5.2% vs. S&P500 DOWN 2.5%
HURRY! Subscribe NOW and get the May 2009 Issue for FREE! !
(Your 1 year, 12 issue subscription will start with next month's issue.)

Message to Bob Brinker Fans:

Did your current investment newsletter tell you to raise cash by taking profits near the market top in 2007?

Mine did! I took profits to increase the cash position of my most aggressive "explore portfolio" to 30%.
Did your current investment newsletter tell you to use cash raised when the markets were near their highs to buy a blue chip DOW stock when the markets were at their lowest levels in 13 years?

Mine did! When the markets made a 13 year low, I had cash in the portfolio and told my subscribers to use some of it to buy some General Electric (GE Charts) shares at $6.76.
Click to view full size GE chart courtesy of stockcharts.com

HURRY! Subscribe NOW and get the April 2009 Issue of "Kirk Lindstrom's Investment Newsletter" for FREE! !

Did your current investment newsletter tell you to use cash raised from when the markets were near their highs to buy a speculative, very high growth telecom growth stock when the markets were at their lowest levels in 13 years and that telecom stock was making an all time low?

Mine did! I had cash in the portfolio and told my subscribers to use it to buy some some Finisar (FNSR Charts) shares at $0.24. Today Finisar (at $0.72) is up triple since my buy alert near the bottom of the bear market.
Click to view full size chart courtesy of stockcharts.com

Since 12/31/98 "Kirk's Newsletter Explore Portfolio" is UP 104% vs. S&P500 DOWN 16% vs. NASDAQ down 22% vs. Warren Buffett's Berkshire Hathaway (BRKA) up 33% (All through 04/30/09) (More Info)

2009 YTD
"Kirk's Newsletter Explore Portfolio" is
UP 5.2% vs. S&P500 DOWN 2.6%

HURRY! Subscribe NOW and get the May 2009 Issue for FREE! !
(Your 1 year, 12 issue subscription will start with next month's issue.)

Tuesday, March 31, 2009

Best Investment Newsletter

2009 YTD (through April 30, 2009)
"Kirk's Newsletter Explore Portfolio" is UP 5.2% vs. S&P500 DOWN 2.6%
HURRY! Subscribe NOW and get the April 2009 Issue for FREE! !
(Your 1 year, 12 issue subscription will start with next month's issue.)

Message to Bob Brinker Fans:

Did your current investment newsletter tell you to raise cash by taking profits near the market top in 2007?

Mine did! I took profits to increase the cash position of my most aggressive "explore portfolio" to 30%.
Did your current investment newsletter tell you to use cash raised when the markets were near their highs to buy a blue chip DOW stock when the markets were at their lowest levels in 13 years?

Mine did! When the markets made a 13 year low, I had cash in the portfolio and told my subscribers to use some of it to buy some General Electric (GE Charts) shares at $6.76.
Click to view full size GE chart courtesy of stockcharts.com

HURRY! Subscribe NOW and get the April 2009 Issue of "Kirk Lindstrom's Investment Newsletter" for FREE! !

Did your current investment newsletter tell you to use cash raised from when the markets were near their highs to buy a speculative, very high growth telecom growth stock when the markets were at their lowest levels in 13 years and that telecom stock was making an all time low?

Mine did! I had cash in the portfolio and told my subscribers to use it to buy some some Finisar (FNSR Charts) shares at $0.24. It is up 50% already as I type!
Click to view full size chart courtesy of stockcharts.com

Since 12/31/98 "Kirk's Newsletter Explore Portfolio" is UP 104% vs. S&P500 DOWN 16% vs. NASDAQ down 22% vs. Warren Buffett's Berkshire Hathaway (BRKA) up 33% (All through 04/30/09) (More Info)

2009 YTD
"Kirk's Newsletter Explore Portfolio" is
UP 5.2% vs. S&P500 DOWN 2.6%

HURRY! Subscribe NOW and get the April 2009 Issue for FREE! !
(Your 1 year, 12 issue subscription will start with next month's issue.)

FREE Updates Mailing List


We email regular "FREE Bob Brinker Fan Club Updates" to everyone on our "Bob Brinker Fan Club" distribution list. If you would like to get on this list, then click this link.


Top Rated Newsletter


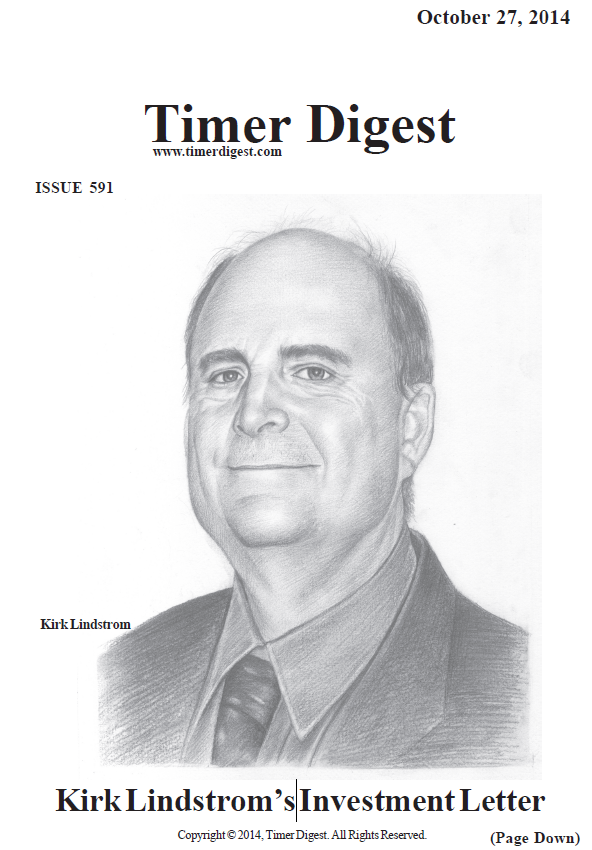
Timer Digest Features
Kirk Lindstrom's Investment Letter
on its Cover

Cick to read the full page article!


US Treasury Rates at a Glance - iBond Rates - LIBOR Rates

Must Read:
Beware of Annuities - Payday Loans Warning