Search Bob Brinker Fan Club Blogs

Showing posts with label Inflation. Show all posts

Tuesday, November 03, 2009

Inflation Protected Series I Bonds Now Pay 3.36%

The Bureau of the Public Debt today announced an earnings rate of 3.36% for Series I Savings Bonds issued from October 2, 2009 through April 30, 2010.

The 3.36% earnings rate for I bonds bought from November 2, 2009 through April 30, 2010 will apply for their first six months after issue. The earnings rate combines a 0.30% fixed rate of return with the 3.06% annualized rate of inflation as measured by the Consumer Price Index for all Urban Consumers (CPI-U). When the inflation rate is less than zero, a bond's earnings rate is less than its fixed rate (but the earnings rate is never less than zero).

Bob Brinker says on the radio we are seeing deflation but that is due to a bubble in inflation a year ago due to higher oil prices. Those good at math can easily see the bubble in the CPI-U data corresponding to oil prices near $150. If the CPI stays where it was for the last (Sept.'09) reading then we will see significant ANNUAL inflation in November and December. For example:
Dec. 2008 CPI-U = 210.228
Sept. 2009 CPI-U = 215.969
Change = 5.741 / 210.228 x 100%
or 2.73% annual inflation!
CPI-U Table
The fixed rate for Series-I Bonds applies for the 30-year life of I bonds purchased during this six-month period.

Minimum purchase:
  • $50 for a $50 I Bond when purchasing paper bond certificates
  • $25 for a $25 I bond when purchased electronically via TreasuryDirect
Maximum purchase(per calendar year):
  • $5,000 in TreasuryDirect and $5,000 in paper bonds
  • $10,000 total per social security number
Denominations:
  • Paper bonds: $50, $75, $100, $200, $500, $1,000, and $5,000
  • Electronic bonds via TreasuryDirect: purchase to the penny for $25 or more
For more information, see:

For older ibonds and what they will pay, see:


Disclaimer: I own Series I Bonds in my personal account. Due to the small amount of i-bonds you can buy now, I own far more TIPS and TIPS funds in my personal and newsletter (FREE SAMPLE) portfolios.

Questions and Comments: "Anonymous" posters should sign your name if you want questions answered. Please use your first name and city at the end of the question such as "Pete from Pittsburgh" or Mark from Maui." Even better, register with Google and get an account with your picture in it then follow this group! Your picture will then show on the "Followers" list on the right hand side of this blog.

Saturday, October 17, 2009

Expected Inflation TIPS Spread Calculation

Bob Brinker often talks about expected inflation on his radio show Moneytalk. This article explains how to do the calculation.

From Calculating Expected Inflation using the TIPS Spread

Expected Inflation or TIPS Spread is the difference between nominal US Treasury bond rates and rates on US Treasury Inflation-Protected Securities. This spread is an indicator of expected inflation. The current rates are listed in table at the end of this article.
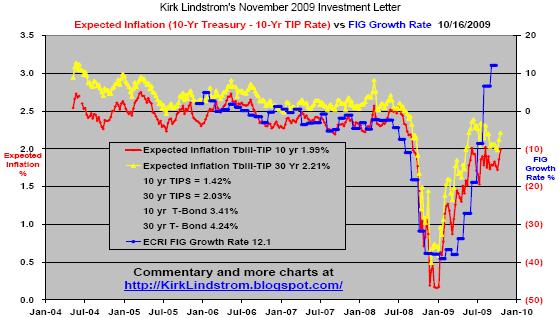
This graph shows expected inflation vs. the growth rate of ECRI’s FIG going back to 2004.
Expected InflationTIPS Spread Graph

ECRI FIG: The Economic Cycle Research Institute, ECRI, monitors over 100 cyclical indexes for major economies and uses the data in effort to make economic forecasts. ECRI's U.S. Future Inflation Gauge, US-FIG,is designed to anticipate cyclical swings in the rate of inflation. On Oct. 2, ECRI’s US-FIG rose again from its March 2009 51-year low to an 11-month high. ECRI's managing director, Lakshman Achuthan, said "the upturns in the US-FIG and its components have become fairly pronounced, pervasive and persistent. Thus, while this is not yet a significant policy concern, U.S. inflation is on the cusp of a cyclical upswing.”

Supply and demand issues can distort the TIPS Spread so buyers need to beware. For example, the Federal Reserve has been busy buying US Treasuries to help banks. The TIPS spread could widen when the Fed stops buying treasuries or goes into tightening mode.

U.S. Treasury Rates - 10/15/09


COUPONMATURITY
DATE
CURRENT
YIELD %
3-Month0.00001/14/2010 0.06
6-Month0.00004/15/20100.15
12-Month0.00009/23/20100.32
2-Year1.00009/30/20110 .95
3-Year1.37510/15/20121.49
5-Year2.37509/30/2014 2.35
7-Year3.00009/30/20162.99
10-Year3.62508/15/20193.41
30-Year4.50008/15/20394.24

TIPS - 10/15/09

COUPONMATURITY
DATE
CURRENT
YIELD%
5-Year1.25004/15/20140 .71
10-Year1.87507/15/20191.42
20-Year2.50001/15/20292.00
30-Year3.37504/15/20322.03

Since 12/31/98 "Kirk's Newsletter Explore Portfolio" is UP 154% (a double plus another 54% !) vs. the S&P500 UP at tiny 5.8% vs. NASDAQ down 0.9% (All through 10/14/09)

As of October 14, 2009, "Kirk's Newsletter Explore Portfolio" is up 30.7% YTD vs. DJIA up 14.1% YTD
(FREE Sample Issue)

HURRY! Subscribe NOW and get the October 2009 Issue for FREE! !
(Your 1 year, 12 issue subscription will start with next month's issue.)


Must Read: Beware of Annuities


Wednesday, September 23, 2009

Bob Brinker's Advice about Gold and Inflation

Bob Brinker had a lot to say about gold (Quote and Charts) and inflation this weekend on "Moneytalk." Below is David Korns "interpretation" of the September 19 and 20, 2009 Moneytalk (Bob Brinker Host) shows. You can read more about David Korn with links to his two newsletters at the end of this article.

Caller: This caller read in Marketimer that Bob believes we can expect improvement in the economy as we move into 2010. With all of the spending going on, and the price of gold going up, when will this initiate inflation that starts negatively impacting the economy. And should he invest in gold? Bob said earlier this year he added to the individual issue section of his Marketimer newsletter that for subscribers who wanted to have some of their portfolio in gold as a hedge, such as a few percentage points, Bob recommended the SPDR Gold Shares (ticker: GLD). Bob said he strongly recommended using the GLD shares IF you wanted to hedge your portfolio with a position in gold. They are currently trading at $98.67 which are near their all-time high. Bob said he likes those shares because they have a low expense ratio, of only about 0.40%. Plus they have an excellent history of tracking gold bullion. Bob said to avoid the various gold schemes out there and stick with an exchange-traded fund like this one.

Kirk Comment: GLD Current Quote and Charts

DAVID KORN: I need to give my subscribers a little warning here about this recommendation by Bob. Since he listed the GLD shares in the "individual issues" section of his newsletter, they are not included in the performance of his model portfolios. To that extent, they get relegated to the QQQQ status (See Kirk Comment). If they go up, Bob can brag about it, but if they go down, it doesn't affect his published performance figure and you probably won't hear him talk about it further. If you listen carefully, Bob is saying he is recommending it to people who WANT to hedge their portfolio against inflation, not because HE thinks there is going to be inflation.

Kirk Comment: Make sure you read:
=> Bob Brinker's QQQ Advice

=> Effect of QQQ advice on reported results
DAVID KORN#2: I think gold these days has a place in a portfolio, beyond just hedging against inflation. Gold does well during periods of political uncertainty, war, etc. And I like the idea of diversifying across many different asset classes. Gold is just too pricy for me to establish a new position in it at this juncture.

Caller: This caller has owned gold (via GLD) shares for some time. She is interested in purchasing some old gold coins. Bob said he would stay away from numismatic coins. Bob said for the average investor numismatics are too expensive because of the mark ups which can be quite substantial. If you are going for real gold, Bob said to stick with gold bullion where you pay the smallest premium. Currently, that would be the the Australian Crown which has a premium of about 0.3% and the Mexican Peso gold coin about 0.66% premium. Those are the best value. If you want to go to the Canadian Maple Leaf, that premium is running about 4.5%. The U.S. Eagle is also around a 4.5%. Those are not numismatic coins, they are pure gold content coins.

DAVID KORN: I agree with Bob that investing in gold coins is a hard way to go as an investment. Basically, only if you are a collector or someone in the numismatic business would it probably be a money making opportunity. However, if you want to learn more about this subject go the web site run by the American Numismatic Association, which is a nonprofit educational organization at this url:

http://www.money.org

INFLATION CALLS AND COMMENTS

Caller: How long will it take to see hyper-inflation given the rate at which the Fed is printing money. Bob said right now we have deflation, not inflation. Over the last year, prices have dropped 1.5%. The problem is when you have an economy that has a tremendous amount of slack in it, which is what we have right now, particularly in areas like unemployment which is close to 10%. When you get too much slack as we have right now, you get deflation.

DAVID KORN: Bob didn't address when we might get inflation in response to this caller, merely noting that we have deflation right now. That¹s the big question of course. It will happen down the road at some point, the question is when. According to the last report from the Economic Cycle Research Institute, their U.S. Future Inflation Gauge has risen from a 51-year low in March to a 10-month high in August. According to ECRI, ³the risk of deflation has clearly dissipated for now, but inflation is not yet a clear and present danger.²

Caller: Isn't deflation being caused by slack in demand for goods and services? Bob agreed that was part of the equation, but you can¹t underestimate the impact of unemployment which has been in an uptrend because it as a lagging indicator. Employers have so many people they can go to and interview for jobs and puts downward pressure on labor costs. This is good for businesses and helps keep prices down. There is a tremendous surplus of qualified workers in the aggregate. That is one of the reasons you are looking at deflation right now at 1.5%.

DAVID KORN: See the article, "Falling prices raise specter of deflation" at this url:

http://tinyurl.com/m4v9r2

Brinker Comment: Yes, the Fed is printing money, but that alone does not cause inflation. You need a growing economy as well. One of the inflation forces is demand pull inflation where the demand for goods becomes so overwhelming relative to the supply outstanding that pulls prices higher. No sign of that. The other kind is cost-pull inflation where the cost of producing goods is so overwhelming ‹ frequently due to higher labor costs ‹ that it pushes prices higher. We certainly don¹t have that now with the historic amount of slack in the economy today. You have to go back to the 1980s to find the amount of labor slack. If you use the U-6 calculation for employment, which includes people who have part time jobs who would like full time jobs and the people who have given up looking for work, that number gets up to 16.8% which is a very very high number. Right now, we have the opposite of demand pull and cost push and as a result we have deflation.

Brinker Comment: There is inflation risk if the economy picks up to a smart pace of growth. When consumers and corporations start to compete with the government for borrowed money, that is when you can see the possibility of inflation. We don¹t have that right now. And in fact, we have the opposite, deflation.

Brinker Comment: In order to get a handle on inflation, Bob said he looks at the 10-year Treasury Inflation Protected Security which is yielding 1.63% and compares it to the 10-year Treasury Bond which is yielding 3.47%. The difference shows us an implied annual rate of inflation over the next ten years of 1.84%. Right now in our country, the rate of inflation is minus 1.5% which is deflation. So in order to get up to the long term implied rate of inflation, we would need to get inflation of 3.3% from current levels.

DAVID KORN: In the latest report this week, the Consumer Price Index showed an increase of 0.4% last month. Excluding food and energy, the core CPI rose just 0.1%.

Brinker Comment: Bob said if down the road, he saw a hyper-inflationary outlook, that could impact the level he would be willing to place at risk in the stock market and could result in a defensive move.

DAVID KORN: Inflation always played a role in Bob¹s stock market timing model, so I am not surprised by this comment.


Kirk Comments:

  1. DateClose
    24-Sep-0997.55
    23-Sep-0998.83
    22-Sep-0999.67
    21-Sep-0998.36
    18-Sep-0998.67
    17-Sep-0999.34
    16-Sep-0999.91

David Korn Links:

Tuesday, July 22, 2008

Bob Brinker Throws Charlie Maxwell Under the Bus

Is Brinker admitting he can't predict the future price of the stock market because he can't predict the future price of oil? On Saturday July 12, Bob Brinker commented on oil prices:
Here we see oil having closed the week at an all-time-record-high, close to $145 for a barrel of oil………..And there is an inverse relationship that has developed between upward spikes in oil prices and the stock market, and that inverse relationship has really been showing up now for some time.

"The stock market wants to see an economic recovery scenario. It does not want to see an increased oil price scenario, which is was it’s seeing right now. Now I wish I could tell you what the price of oil is going to be in a week, a month, a year. I don’t know. I have no way of knowing and I think only a fool would try to forecast the price of a barrel of oil in the world we live in…….”
Is Bob Brinker calling himself and his guest Charlie Mawell fools for trying to predict the price of oil less than a year ago?

David Korn Moneytalk Commentary: (November 10-11, 2007):
Charlie Maxwell, the oil energy expert, was on Moneytalk in September and predicted that oil should stay in a range of $50s up to $80 a barrel for another two years. Bob took up this mantra in response to a caller some weeks back saying he was going to go with Charlie's prediction. Up until recently, Charlie had been pretty on the mark as oil had only gone to the upper $70s. With oil now knocking on $100 a barrel, the prediction Charlie last made is pretty much out the window.
David Korn Moneytalk Commentary (May 19-20, 2007):
Maxwell/Brinker: Bob opened the interview praising Charlie for his predictions on Moneytalk that the price of oil would trade in the $50s to the $70s which has been right on the mark in recent years. Bob asked Charlie if he had changed his forecast. Charlie said we have seen oil go from $25 a barrel in early 2003, to as high as $75 a barrel, with a peak at $78. There was a lot of oil being traded at $75. The rise from $25 to $75 is huge and represents a 200% increase. Nevertheless, Charlie said he thinks supply and demand are roughly in balance today and might stay here for a while, particularly given the weakness that is going on in the U.S. economy. A slower U.S. economy can translate into reduced imports, and thus slow foreign demand from countries like China. This period of transition where we stay in the range of $50s up to $80 a barrel should stay with us for another two years.
  • Kirk Comment: Just today the CFTC task force study concluded supply and demand are main factors in oil price run up to record levels
With this as a backdrop, Charlie thinks that by 2010-2011, we could see oil trade at over a $100 a barrel.

David Korn: Charlie has actually gone on record in the past projecting that West Texas Intermediate Crude ($WTIC) would rise to rise to $85 by 2010, $180 by 2015 and $300 by 2020. Based on today's interview, it looks like he raised his 2010 prediction by $15 a barrel.I don't think Charlie Maxwell and Bob Brinker are fools. They were just very, very wrong.
James Rogers (Mr. Bow Tie as Bob Brinker used to call him) and many others predicted commodity prices would soar for many reasons including "easy money made available by the Federal Reserve."

For years Bob Brinker has been in favor of a low Fed Funds rate as he has dismissed the effects on inflation these low rates have. Brinker was wrong while others like me who warned about inflation from higher priced oil (and other rising commodities) were correct.


The above chart shows the S&P500 is back to where it started 2006 while the price of oil has more than doubled. The chart also shows the S&P500 made a record high even as the price of oil soared 50% from $60 to $90.

Bob Brinker needs to look at the credit crisis for what caused the stock market to have a bear market. Here is the same chart with the Financial Sector exchange traded fund, XLF, added.

This chart of oil prices, the S&P500 and XLF since June 1st shows just how wrong Brinker is about what is driving stock prices. Hint... it is not oil!

I think Bob Brinker has thrown Charlie Maxwell under the bus so he can blame someone for missing a bear market over the price of oil. The trouble is, the collapse of the financial sector is driving the price of the stock market, not oil! Oil is where it was in early June while the S&P500 is down considerably. Brinker should admit he was wrong and stop trying to find scapegoats.

Friday, June 13, 2008

Bob Brinker, May Inflation and GDP Growth

The US Labor Department reported today that May CPI inflation was up 4.2% over the May 2007 level. The components of CPI with the largest gains were:
This graph of the year over year percent change in the unadjusted CPI data shows inflation is anything but low on an historical basis.

[Click graphs to see larger images]


Bob Brinker said:
The other day, Larry Kudlow (CNBC) put up a chart of inflation for the past years. A few years ago when energy prices were low and the economy was growing at about 3%, inflation was about 1.9% on average. Since then, energy prices have soared, our economy has slowed to a near standstill and yet inflation has MORE than doubled!
  • ==>"The CPI is up 4.2% in the past year and has risen at a 4.9% annual pace over the past three months. "
The Fed lowered rates to help save our banking industry from the mess the idiots at the helm of places like Citibank, Wachovia, Bear Strearns, Lehman, etc. made. Those rate cuts caused the dollar to crash which has made inflation as measured in things like Gold or oil soar to hyper inflationary rates... but we don't see hyper inflation here because we measure inflation in dollars.

Economic growth has nearly vanished as we crawl along with less than 1.0% GDP growth while our inflation has doubled over the very low rate of inflation we had just a few years ago when economic growth was 3 to 5% and oil was less than half what it is today.

This final chart from my friends at Martin Capital show CPI inflation is not low as Brinker claims. Furthermore, it shows producer price inflation is even worse which puts a strain on profits and explains part of the downward revisions in S&P500 earnings estimates since companies are reluctant to raise prices now to pass on inflation to their customers. If the economy improves, then this "inflation debt" will eventually get passed to customers through higher prices since companies are in business to make money.


The chart of yearly change in CPI inflation (dark green curve on the chart) shows inflation is near a 10-year high. The price of oil has more than doubled in the past year which has caused inflation to roughly double from low 2% to a 4.9% annual pace over the last three months!

The good news is the Federal Reserve and ECRI both expect inflation to moderate since very few expect the price of oil to double again in the next year from the current level of $135/barrel. My "Inflation Expectation" chart of the 10-year US Treasury rate minus the 10-year TIPs rate show bond investors expect long term inflation to run about 2.53%.

Friday, May 30, 2008

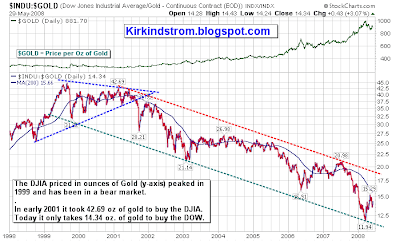
Inflation, Gold and the DOW

Bob Brinker has been negative on gold as an investment since the 1990s, claims inflation has not been a problem and the falling dollar has not been an issue since we buy things in dollars.

click charts courtesy of stockcharts.com to see full sized images


Cutting the Fed Funds target rate from 6.50% in January 2001 to 1.0% in June 2003 may have inflated the US stock market out of its bear market when priced in dollars but it had consequences.

This chart of the DOW Jones Industrial Average (DJIA) priced in gold shows the markets are not as healthy as one might think due to the decline of the US dollar.

When you price the markets in a currencly like gold that reflects inflation, such as gold, the markets remain in a bear market! This may explain why the US consumer feels she is continously squeezed despite claims from Bob Brinker that inflation has not hurt the consumer.

Cutting interest rates to get the US out of a recession may have worked but the inflation in commodites and devaluation of the US dollar it caused has caused pain for the US consumer. This pain is often blamed on president Bush who took office just as the DOW/Gold ratio broke out of the "symetrical triangle" pattern. I think it also explains why a populist like Barak Obama with the most liberal voting record in the US Senate has a good chance to win the upcoming presidential election.

More on "Symetrical Triangle" chart pattern

A Great Father's Day Gift!

The Bible for technical analysis, Technical Analysis of Stock Trends, by Robert Edwards and John Magee, says about 75% of symmetrical triangles are continuation patterns and the rest mark reversals. The "return to the apex" of the Gold/DOW ratio in late 2001, early 2002 confirmed the technical breakdown of this chart pattern. For more information, read chapter eight "Important Reversal Patterns - The Triangles."

Come Join Us!

Request Invitation to FREE facebook group "Investing for the Long Term" where you can participate in the "Bob Brinker Discussion Forum.

"We email regular "FREE Bob Brinker Fan Club Updates" to everyone on our "Bob Brinker Fan Club" distribution list. If you would like to get on this list, then click this link.

Wednesday, May 21, 2008

Fed Signals Rate Cuts Are Done, Lowers Growth Forecast for 2008

Today the Federal Reserve released the minutes from its last meeting. In these minutes they said cutting rates from 2.25% to 2.00% at the last meeting was a "close call" and they think future rate cuts are unlikely even if the economy contracts.

The FOMC also released their updates for GDP to rise between 0.3% to 1.2% this year. This is a reduction in their prior forecast of 1.3 to 2% GDP growth for 2008.
  • The staff projection pointed to a contraction of real GDP in the first half of 2008 followed by a modest rise in the second half of this year, aided in part by the fiscal stimulus package. The forecast showed real GDP expanding at a rate somewhat above its potential in 2009, reflecting the impetus from cumulative monetary policy easing, continued strength in net exports, a gradual lessening in financial market strains, and the waning drag from past increases in energy prices.
They also raised their forecasts for the unemployment rate, CPI or "headline inflation" and core inflation as measured the price index for personal consumption expenditures, or PCE, that Bob Brinker has discussed on his show.

For the short term, they expect inflation pressure from higher energy prices to continue:
  • The forecast of headline PCE inflation in 2008 was revised up in light of the further run-up in energy prices and somewhat higher food price inflation;
  • headline PCE inflation was expected to exceed core PCE price inflation by a considerable margin this year.
  • In view of the projected slack in resource utilization in 2009 and flattening out of oil and other commodity prices, both core and headline PCE price inflation were projected to drop back from their 2008 levels, in line with the staff's previous forecasts.
For 2010 they expect inflation as measured by the overall PCE to moderate.
  • On balance, participants expected the recent increases in oil and food prices to continue to boost overall consumer price inflation in the near term; thereafter, total inflation was projected to moderate, with all participants expecting total PCE inflation of between 1-1/2 percent and 2 percent by 2010.

From An Alternative To Bob Brinker's Inflation Outlook:

  • Bob Brinker: "We have always maintained that rising oil prices act as a tax on consumers, and are therefore counter-inflationary as they have a negative impact on consumer discretionary spending power." (No mention of core inflation)

Sunday, May 18, 2008

An Alternative To Bob Brinker's Inflation Outlook

This weekend Bob Brinker said he didn't buy into the conspiracy theories that some have which say real inflation is much higher than officially reported. This was no surprise since Brinker is on record of predicting low inflation while saying a higher price for oil is deflationary. From March Inflation Up on Higher Energy and Food Costs:
  • "We have always maintained that rising oil prices act as a tax on consumers, and are therefore counter-inflationary as they have a negative impact on consumer discretionary spending power." (No mention of core inflation)

If you want a good discussion of "the other side of the issue" then I recommend reading

Excerpts:

  • The real numbers, to most economically minded Americans, would be a face full of cold water. Based on the criteria in place a quarter century ago, today's U.S. unemployment rate is somewhere between 9 percent and 12 percent; the inflation rate is as high as 7 or even 10 percent; economic growth since the recession of 2001 has been mediocre, despite a huge surge in the wealth and incomes of the superrich, and we are falling back into recession.
    .
  • Readers should ask themselves how much angrier the electorate might be if the media, over the past five years, had been citing 8 percent unemployment (instead of 5 percent), 5 percent inflation (instead of 2 percent), and average annual growth in the 1 percent range (instead of the 3–4 percent range). We might ponder as well who profits from a low-growth U.S. economy hidden under statistical camouflage. Might it be Washington politicos and affluent elites, anxious to mislead voters, coddle the financial markets, and tamp down expensive cost-of-living increases for wages and pensions?
    .
  • Since the Consumer Price Index was calculated by tracking a bundle of prices, so-called "core" inflation would simply exclude, because of "volatility," categories that happened to be particularly troublesome: at that time, food and energy. Core inflation could then be spotlighted when the "headline" number was embarrassing, as it was in 1973 and 1974. (The economic commentator Barry Ritholtz has joked that core inflation is better called "inflation ex-inflation"— i.e., inflation after the inflation has been excluded.)
    .
  • Nothing, however, can match the tortured evolution of the third key number, the somewhat misnamed Consumer Price Index. Government economists themselves admit that the revisions during the Clinton years worked to reduce the current inflation figures by more than a percentage point, but the overall distortion has been considerably more severe. Just the 1983 manipulation, which substituted "owner equivalent rent" for home-ownership costs, served to understate or reduce inflation during the recent housing boom by 3 to 4 percentage points.

Kirk Comment: An item I see missing from CPI calculations is the decrease in quality of customer service. You may get an item 50% cheaper these days but how much do you save if you value your time and spend hours on the phone with people in other countries to get information you should not have had to ask for? It is probably not a big deal until you add up all the time you could spend on the phone disputing bills to getting help for products that don't work rather than just live with it because it is not worth the hassle.


Bad Money: Reckless Finance, Failed Politics, and the Global Crisis of American Capitalism
by Kevin Phillips (Author)

(Hardcover)


J. Lewis wrote: "I have just ordered this book, but based on the excerpt published in this month's Harper's, it is a must-read for anyone concerned about our nation's economy and our position in the world. It appears to be lucid and well written, and it is not a political screen. (The bad guys are every administration in recent memory, not just the Bushes.)

Simply put, over the past 30-40 years, various administrations have changed the statistical bases of economic analysis. If consistent standards were used, inflation and unemployment would be shown to be much higher and the GNP much lower than we believe. We are losing the economic battle, but do not understand the extent to which we are because we have succeeded in lying to ourselves."

Wednesday, April 16, 2008

I-Bond Rates To Soar on High Inflation Data

Bob Brinker should have fun explaining how this high inflation data is good news for iBonds this weekend. The US Bureau of Labor Statistics released its March 2008 Consumer Price Index data today. PRESS RELEASE.

Currently newly purchased I Bonds pay 4.28% for 6 months after purchase with a base rate of 1.20%. This rate is good through May 2008 when they will calculate a new inflation adjustment for the next six month period which we estimate will be over 6% after the latest inflation adjustment!

March CPI up 0.9%; Yearly Inflation Rate Over 4%

If you own iBonds (Inflation protected bonds) that both Bob Brinker and I have recommended in the past, then the number you care about is the "Consumer Price Index for All Urban Consumers (CPI-U) without seasonal adjustments (SA)":

Runner26 posted the current estimate for Ibonds in our I Bonds or iBonds forum on facebook's "Investing for the long term" this morning.

The March jump in CPI was large. [Kirk's Comment: I-bonds use the Not Seasonally Adjusted (NSA) data, so while the headline CPI number with "seasoinal adjustments" was only 0.3%, the NSA was a whopping 0.9% increase for the month. This number matches what many feel in their pocketbooks too.]
.
My estimate for the new rates for existing bonds will be the following when their 6-month reset period arrives.
.
Base----Rate
1.0%----5.86%
1.1%----5.97%
1.2%----6.07%
1.3%----6.17%
1.4%----6.27%
1.6%----6.48%
2.0%----6.89%
3.0%----7.91%
3.3%----8.22%
3.4%----8.32%
3.6%----8.53%
.
Current I-Bonds are at a 1.2% base rate, which means if you buy them before the end of this month, you will get 4.28% for 6 months, followed by 6.07% at their next reset in 6 months. You may find this attractive.
.
If they leave the base rate at 1.2%, new May issue bonds would carry a 6.07% rate. My guess would, given the low current base rates being paid for TIPS, the base rate for new May issue I-bonds will be LOWER, and it likely better to purchase before the end of this month. Be aware however, that I have been surprised before by the actions of the Treasury.

For CA residents in the 9.3% state tax bracket, the equivalent taxable rates for the two periods are 4.719%/6.692%.

So, high inflation before seasonal adjustments is not bad news for holders of I bonds and TIPS but inflation is bad news for consumers not making six figure plus incomes who spend most of what they make.

Vanguard's TIPS index fund (VIPSX) was up 11.59% in 2007 and is up 4.74% YTD in anticipation of these high inflation readings. With inflation expected to moderate, I don't expect to see this level of performance continue.

Disclaimer: I have a fairly large position in TIPS in both my personal account and some of the newsletter porfolios in "The Retirement Advisor" investment letter. I also recommend TIPS as part of a 3-item alternative to the easy to track "Total Bond Fund" in "Kirk Lindstrom's Investment Newsletter" where I may again recommend iBonds with these attractive rates.
.

Tuesday, April 15, 2008

March Inflation Up on Higher Energy and Food Costs

Bob Brinker will have a hard time telling his audience that inflation is low after today's report. According to the US Government, wholesale prices, as measured by the Producer Price Index (PPI) gained 1.1% in March on higher energy and food prices. Press Release Text

According to the US Labor Department, energy prices rose 2.9% in March, while food prices gained 1.2%.

The core producer price index, which excludes volatile food and energy, rose 0.2%.

Year-over-year, the PPI is up 6.9% with core PPI up 2.7% over the same time period.

The report states:

During the first quarter of 2008, the finished goods index rose at a 10.2-percent seasonally adjusted annual rate (SAAR), after climbing at an 11.5-percent SAAR during the fourth quarter of 2007. Much of this slower rate of increase can be traced to prices for finished energy goods (EC: Gasoline is a finished energy good while crude oil is raw material), which moved up at a 22.5-percent SAAR for the 3 months ended in March after jumping at a 44.1-percent SAAR for the 3 months ended in December.

Last year, Peter Brimelow reported (2nd to last paragraph) that Bob Brinker said the following about inflation in his newsletter:
However, Brinker clearly does not regard inflation as a threat, and congratulates Federal Reserve chide Ben Bernanke for refusing to monetize oil-price increases:
    "We have always maintained that rising oil prices act as a tax on consumers, and are therefore counter-inflationary as they have a negative impact on consumer discretionary spending power."
There was no mention of "core inflation" in that Marketimer quote.

Honeybee reported in post #1294 at our Bob Brinker Discussion Forum that Bob said of inflation:
Brinker: "If you’re a Moneytalk listener you know that we have repeatedly said that those that were forecasting runaway inflation, hyper inflation – whatever you want to call it, were completely wrong because they were basing their forecast on a bogus centerpiece……..high oil prices would result in runaway inflation – not true…….”

That is a not true. PERIOD. I can't name one person of consequence that said we would have run-a-way inflation with higher oil prices if the Fed raised rates. But, one could argue that prices rising at a seasonally adjusted rate of 10.2% is close to being the very high inflation we saw in the 1970s and 1980s.

MANY of us said higher oil is inflationary and the Fed was right to raise rates to keep inflation in check. Brinker disagreed at the time. He was wrong so he "misrepresents" what he said in the past.

People also said that if the Fed had kept rates low and let the housing bubble continue to expand, then we would have an inflation problem from higher energy prices. Brinker disagreed and asked on the radio: "What does Allan Greenspan have against people's homes going up in value?" as he argued they should have stopped raising rates at 4% when speculation in houseing was out-of-control.


Brinker:The inflation hawks, that’s what they said would happen. They said that rising oil prices would cause rising core prices and it did not happen – they were completely wrong.”
Bob is in denial as the last three months worth of data shows core CPI at 2.7% is well above the Fed's 1.0 to 2.0 comfort zone. Bernanke said before Congress just the other day that inflation was too high. A double digit seasonally adjusted rate of inflation for the past six months is far from "low inflation" that Brinker predicted we would see if energy prices went up.

Brinker failed to predict that the demand push for energy is coming from outside the US! The more the Fed cuts rates, the higher energy prices go up due to the falling dollar.

In January 2000 Brinker thought "inflation approaching 3%" was too high and in the presence of over valuation he took 60% of his portfolios out of the market. Maybe if he had seen higher inflation last fall and the impacts on earnings when the markets were in the 1500s and the sentiment indicators were screaming "TAKE PROFITS" he could have taken 20% out so he'd have money to buy now in the mid 1200s to low 1300s.


With producer prices up 6.9% year-over-year they will have to pass these on to consumers or suffer from lower profits. Neither of these are good for the stock market which explains much of why the stock market is down nearly 20% off its high.

The problems in the US economy today are from the housing bubble bursting and the bankers lending money to people who could not pay it back on the agreed upon terms. Outside the US the international econmies are doing much better and the demand for energy and food there is driving the prices higher causing inflation.

I lost most of my respect for Brinker long ago over how he refuses to admit his mistakes. But I have to admit listening to see what lengths he will go to try and spin the facts and figures to avoid admitting he is wrong is very entertaining radio!

March Inflation Up on Higher Energy and Food Costs

Wholesale prices, as measured by the Producer Price Index (PPI) gained 1.1% in March on higher energy and food prices. Press Release Text

According to the US Labor Department, energy prices rose 2.9% in March, while food prices gained 1.2%.

The core producer price index, which excludes volatile food and energy, rose 0.2%.

Year-over-year, the PPI is up 6.9% with core PPI up 2.7% over the same time period.

The report states:


During the first quarter of 2008, the finished goods index rose at a 10.2-percent seasonally adjusted annual rate (SAAR), after climbing at an 11.5-percent SAAR during the fourth quarter of 2007. Much of this slower rate of increase can be traced to prices for finished energy goods (EC: Gasoline is a finished energy good while crude oil is raw material), which moved up at a 22.5-percent SAAR for the 3 months ended in March after jumping at a 44.1-percent SAAR for the 3 months ended in December.

Honeybee reported in post #1294 at our Bob Brinker Discussion Forum that Bob said of inflation:


Brinker: "If you’re a Moneytalk listener you know that we have repeatedly said that those that were forecasting runaway inflation, hyper inflation – whatever you want to call it, were completely wrong because they were basing their forecast on a bogus centerpiece……..high oil prices would result in runaway inflation – not true…….”

That is a not true. PERIOD. I can't name one person of consequence that said we would have run-a-way inflation with higher oil prices. But, one could argue that prices rising at a seasonally adjusted rate of 10.2% is close to being the very high inflation we saw in the 1970s and 1980s.

MANY of us said higher oil is inflationary and was right to raise rates to keep inflation in check. Brinker disagreed at the time. He was wrong so he "misrepresents" what he said in the past.

People also said that if the Fed had kept rates low and let the housing bubble continue to expand, then we would have an inflation problem from higher energy prices. Brinker disagreed and asked on the radio "What does Allan Greenspan have against people's homes going up in value?" as he argued they should have stopped raising rates at 4%.
Brinker:The inflation hawks, that’s what they said would happen. They said that rising oil prices would cause rising core prices and it did not happen – they were completely wrong.”
Bob is in denial as the last three months worth of data shows core CPI at 2.7% is well above the Fed's 1.0 to 2.0 comfort zone. Bernanke said before Congress just the other day that inflation was too high. A double digit seasonally adjusted rate of inflation for the past six months is far from "low inflation" that Brinker predicted we would see if energy prices went up. Brinker failed to predict that the demand push for energy is coming from outside the US!

In January 2000 Brinker thought "inflation approaching 3%" was too high and in the presence of over valuation he took 60% out his portfolio out of the market. Maybe if he had seen higher inflation last fall and the impacts on earnings when the markets were in the 1500s and the sentiment indicators were screaming "TAKE PROFITS" he could have taken 20% out so he'd have money to buy now in the mid 1200s to low 1300s.


With producer prices up 6.9% year-over-year they will have to pass these on to consumers or suffer from lower profits. Neither of these are good for the stock market which explains much of why the stock market is down nearly 20% off its high.

The problems in the US economy today are from the housing bubble bursting and the bankers lending money to people who could not pay it back on the agreed upon terms. Outside the US the international econmies are doing much better and the demand for energy and food there is driving the prices higher causing inflation.

I lost most of my respect for Brinker long ago over how he refuses to admit his mistakes. But I have to admit listening to see what lengths he will go to try and spin the facts and figures to avoid admitting he is wrong is very entertaining radio!

Thursday, April 03, 2008

Bob Brinker & Ben Bernanke On High Inflation

Bob Brinker says he is right and inflation is low. On the Blog article Bob Brinker: Inflation and the Fed Honeybee quotes Bob Brinker with the following Sunday March 30th statement:

Bob Brinker said: “Well, if you’ve been listening to Moneytalk for a while, you know full well that I’ve maintained that this business about run-away inflation is total nonsense. This business about pre-occupation with high inflation is total nonsense. We have said over and over on a consistent on-going basis that the problem is not inflation. And as has been the case, we’ve received more good news on inflation this past week. The most important gauge of inflation, according to the Federal Open Market Committee, is an index known as the Chain Price Index for Personal Consumption Expenditures. I usually refer to this on the program as the Personal Consumption Expenditure Price Index. And this index came through this week showing some really outstanding numbers showing that inflation is decreasing. The year-over-year rate of inflation on the Index came in at 3.4, in the latest data. And the year-over-year core index – excluding food and energy – came in at 2%.
.
Now you’ll remember that the inflation hawks told us last year that because oil prices were going up, that was going to feed into the overall rate of inflation and cause higher inflation
.
and Brinker concludes with:

How did it turn out that so many people, including members of the Federal Reserve, were wrong when they said higher oil prices would create an inflation problem? How is it that here on Moneytalk, we were able to correctly assess the situation by saying over and over again that this is not inflationary. In fact, it’s contractionary..........That’s what it’s all about.
Federal reserve chairman Ben Bernanke testifying before Congress on April 3, 2008 about the Bear Sterns rescue was asked about inflation:

Question from Senator Johnson: "Are you concerned about inflation?"

Answer by Chairman Bernanke: "Of course, we are concerned about inflation. Inflation has been too high. Over the last year, it has been about three and a half percent instead of a little over two percent in the previous year. The primary reason for the high inflation is rapidly increases in prices of globally traded commodities including crude oil and food, among others. It is our expectation, which is consistent with prices seen in futures markets, and that these prices will moderate in the coming year…. Therefore, overall inflation will tend to slow. However, we are aware of the uncertainties with that. "
Back in January 2000 Brinker didn’t think 3% inflation was low and he thought a falling dollar and higher prices for imports were a problem. In fact, he wrote in his January 8, 2000 Marketimer:
"Here is our current analysis of the five root causes of a bear market:
.
#3) High Inflation: The annual rate of gain in the consumer price index is approaching 3%. Higher import prices, up 5.5% during the past year, show the powerful impact of the weaker dollar on inflation. Also, the Columbia University Leading Inflation Index has deteriorated over a period of several months and shows an annual rate of change close to 5%. These are the factors that have damaged the bond market, and these same factors pose added risk to future stock market returns in a very highly priced valuation environment.”
Perhaps if Brinker had remembered how he thought about inflation “approaching 3%” due to higher import prices from a weak dollar he might have taken some profits last year when the markets were at all time highs in the "high 1500s" before they corrected as much as 20.2% to the "mid 1200s!"

Click the graph to see it full sized.

Since the highs, the S&P500 has corrected as much as 20.2% on an intraday trading basis.

Brinker "got it right" back in 2000 when he correctly said higher import prices were a problem for inflation. The Fed killed economic growth back them by raising rates too high to reverse the high inflation. That gave us a recession. That was probably worth 20% of the S&P500's 50% decline. The other 30% of the decline was easily due to over valuation which Brinker also was correct on back then.

After the recession where the Fed lowered the Fed Funds rate to 1.0% to prevent deflation, they created a housing bubble by keeping the Fed Funds rate too low for too long. Of course, this is easy to see now with 20:20 hindsight.

This time, Brinker was wrong about the Fed and inflation. Thus, he missed the opportunity to take profits before the 20% decline like he did in January 2000. Fortunately, he has valuation in his favor and I doubt we will go below the 20.2% correction we've already had.

= = = = = = = = = = = = = = = = =

Click to view the attached (but slow to load) PDF file: Take Profits & Sell Sentiment Indictors from The Market Top and read the more current report Weekly Put/Call Ratio at Record Highs

If you want to know what I have been buying in this period of weakness with my profit taking dollars from selling when the market was higher, Subscribe to Kirk's Investment Newsletter TODAY and get the April 2008 issue FOR FREE!

We email regular "FREE Bob Brinker Fan Club Updates" to everyone on our "Bob Brinker Fan Club" distribution list. If you would like to get on this list, then click this link.

Wednesday, February 20, 2008

January Inflation and Housing Numbers

After today's data, I doubt even Bob Brinker can continue to say inflation is low. The US Labor Department reported inflation as measured by the Consumer Price Index (CPI) remained elevated in January. Selected highlights of the details at Consumer Price Index Summary:
  • January CPI up 0.4%. In the past when this was only 0.1%, Bob Brinker has "annualized" this number by multiplying it by 12. Multiply 0.4% by Bob's 12 and we get an annualized inflation rate of 4.8%!
  • Due to seasonal effects, December CPI was revised up to 0.4% from its earlier estimate of 0.3%
  • Excluding volatile food and energy, January Core CPI was up 0.3%, the largest gain since June 2006
  • Year-over-year CPI up 4.3% in January.
  • Year-over-year core inflation is up 2.5% over the same period, the fastest pace since February 2007.

Inflation Details from CBS Marketwatch:

  • Energy prices rose 0.7% in January after much larger increases in the past two months.
  • Gasoline prices rose 1.2% after seasonal adjustment. Natural-gas prices rose 2.2%.
  • Food prices rose 0.7% in January, the largest increase since last February.
  • The gain in the core rate reflects accelerated prices for apparel, medical care, recreation, and education.
  • Shelter prices, which represent about 30% of the CPI, rose 0.3% in January.
  • Transportation prices rose 0.5%, led by higher fuel prices.
  • Medical-care prices increased 0.5%, as prescription drug prices rose 0.7%, the largest gain in a year.
  • Apparel prices rose 0.4% after seasonal adjustments. Airline fares rose 0.8% in the month.
  • Food prices were unchanged in January.

Housing

Housing Starts UP 0.8% vs down 14.8% in Decenmber

Building Permits down 3.0% vs down 7.1% in December. On a seasonally adjusted basis, building permits are running at a rate of 1.08M, the lowest reading since November 1991!

Slow single family housing means people need appartments to live in. Single-family housing starts fell by 5.2% in January, but starts on structures with two or more units rose by 22.3%.

Yesterday the National Association of Home Builders (NAHB) reported that the mood of U.S. homebuilders improved slightly for a second straight month. The NAHB reported their home builders' housing market index rose to 20 in February from 19 in January.


Visit our Facebook Bob Brinker Discussion Forum at "Investing for the Long Term" to ask questions or discuss this article.
.

Friday, January 11, 2008

FOMC Chairman Ben Bernanke says 'Substantive' Rate Cuts May Come Soon

Bob Brinker has said the Federal Reserve Chairman Ben Bernanke has been making rookie mistakes to worry too much about inflation. In a speech yesterday FOMC Chairman Ben Bernanke strongly hinted the Fed would reduce its short-term interest-rate target, probably by half a percentage point from its current 4.25%, at the central bank's next meeting, Jan. 29-30. He said the Fed could act before then if needed but it would take a dramatic deterioration in the markets or exceptionally bad economic data.

From Bob Brinker Moneytalk Summary, January 5-6, 2008, Honeybee wrote:

Excerpts of Brinker's reply (to a caller): “I think we can identify what we certainly know would cause a recession. One thing would be if the Fed gets it wrong. If the Fed interprets, for example, high oil prices as a priority – now so, far they have not done this…………then they would make the mistake, which would be very disappointing, that they would think that they can actually control oil prices – which they cannot. They have no power whatsoever. Oil is a global commodity, and they have no power whatsoever at the Fed, or to even have a significant impact. If they make the mistake of thinking that they have to fight oil prices by raising rates, then that will cause a recession. All they have to do is go back into a pattern of raising interest rates –tightening monetary policy--that will definitely cause a recession. There is no question in my mind.
.
So far they have gone the other way……..I expect them to cut rates again by the end of this month – at the January 30th meeting, at the latest……And I wouldn’t be surprised to see them cut rates again after that, because they are behind the curve. We have a ROOKIE at the controls at the Fed. I’ve talked about it for months, and you have ROOKIE risk. And ROOKIE risk tells you that the ROOKIE in control may not do everything the perfect way…….They were locked in their IVORY TOWER going into August. We were badgering them to death – I don’t think they care.
"
Bernanke said the Fed must "remain exceptionally alert and flexible, prepared to act in a decisive and timely manner and, in particular, to counter any adverse dynamics that might threaten economic or financial stability."

The Wall Street Journal reported today:
  • The speech comes at a crucial time for the Fed. Mr. Bernanke noted that until last spring the central bank thought it was facing "the classic problem of managing the midcycle slowdown" -- guiding the economy from rapid to slower growth in order to keep inflation in check. But the dramatic deterioration in housing and credit markets since then has significantly raised the risk of recession -- an outright contraction of economic activity and employment lasting at least six months.
  • Inflation concerns figured in yesterday's decisions by the ECB and the Bank of England to leave their interest-rate targets at 4% and 5.5%, respectively.ECB President Jean-Claude Trichet suggested at a news conference following the ECB's meeting that the threat of higher inflation remains the central bank's top concern. Euro-zone consumer-price inflation in November and December was at a 6½-year high of 3.1%, well above the ECB's goal of just under 2%, and policy makers expect high food and energy prices to keep the rate elevated in coming months. Mr. Trichet warned the ECB "is monitoring wage negotiations...with particular attention."
  • The Bank of England will release minutes of yesterday's meeting on Jan. 23. They are expected to show the bank kept rates steady because of inflation concerns -- including fresh utility-price increases and the pound's 7% fall against the dollar since November.

Asked about a possible recession, Mr. Bernanke said, "The Federal Reserve is not currently forecasting a recession. We are forecasting slow growth. But...it's very important for us to stand ready...to address those risks and provide some insurance against those negative outcomes."

What changed for Mr Bernanke?

The U.S. employment report for December showed a decline in private-sector jobs. Mr Bernanke said this was "disappointing," and added "[Previously,] relatively steady gains in wage and salary income [were] providing households the wherewithal to support moderate growth" in spending. "Should the labor market deteriorate, the risks to consumer spending would rise," he said.

The higher unemployment rate, 5% in December up from 4.7% in November, shows that one inflationary pressure, higher wages from tight labor markets, is declining.

To make the Fed's job harder, the labor department yesterday reported initial claims for unemployment benefits fell 15,000 to 322,000 last week, the second straight decline, suggesting the labor market isn't deteriorating dramatically.

When former FOMC Chairman Allan Greenspan kept increasing interest rates above 4% to reign in the housing bubble, Bob Brinker complained on his Moneytalk radio show by saying:
"What does Allan Greenspan have against people's home prices going up?"

Clearly the FOMC was right to be concerned and they probably should not have kept rates so low for so long and better monitored the loans member banks were making so they would not have a mess to clean up today.

Sunday, December 16, 2007

Bob Brinker Moneytalk Recap: Saturday Dec 15, 2007

Bob Brinker FINALLY correctly stated the link for oil prices and CPI, a measure of inflation, Saturday.

If anyone wonders if Bob Brinker reads the blogs and message boards that are critical of some of what he says, yesterday's complete about face where he correctly stated the FOMC could raise rates to lower the impact of higher price oil on inflation should end all doubts. This is what I've been posting for some time to those who have said Brinker is right that higher priced oil is not inflationary.

My Friday article "Bob Brinker WRONG about Oil Prices and Inflation"

Brinker also correctly said that it is hard to lower the demand for oil by raising rates because much of the new demand comes from China and India. We can slow their demand for oil by killing demand in the US , their big customer, via a recession or slowing growth to just above zero but those economies will still want to grow as they embrace capitalism.

About the only thing he held on to from his past incorrect statements about oil not being inflationary was saying "core inflation is up a small 1.9% despite huge gains in oil prices." This is not "small" and is at the upper end of the Fed's acceptable range of 1 to 2%. It was higher at 2.9% earlier this year but when core inflation fell to under 2%, the FOMC started cutting rates. Given the collapse in the housing market, if not for inflation from higher priced oil and other commodities, we might be worried about a dangerous deflationary spiral from falling housing prices and repriced SIVs (note #1).

Bob Brinker made a lot of good comments about how we wasted our opportunity to get off Middle East oil after the 1974 embargo. His guest, an auto writer emeritus from Forbes, said America is a bunch of fat people who want and need big, comfortable cars to drive to their $100,000 jobs and the current price of oil is not a big deal relative to being comfortable. He also said this was true in Europe too where rich Germans love their big, powerful cars. (just look at the big, powerful, heavy Audi's, BMW's and Mercedes with 8 cylinder engines. ) The guest also said he believes gasoline will have to get to about $7 per gallon before Americans make significant changes in driving habits.


Notes:
  1. SIV is "Structured Investment Vehicle." Here is a good article on SIVs called "Shedding Light on SIVs"

Friday, December 14, 2007

Bob Brinker WRONG about Oil Prices and Inflation

For years Bob Brinker has been telling his audience that higher prices for energy, especially oil for heating and gasoline, were not inflationary. (Reference 2006 Monologue "Oil prices literally going through the roof, and yet to the consternation of many, not listeners to Moneytalk, but to many, including, apparently, the Fed Chairman, they think oil prices are inflationary. That's because they don't understand, they don't understand the taxing effect that these higher gasoline prices have on your pocketbook.")

Brinker correctly says higher energy prices "act like a tax" and slow growth, but he forgets that tax rates are not 100%. This means that oil prices are "less inflationary" than if they didn't act as a tax, but they are still inflationary. Taxing your pay check doesn't mean your pay check turns negative! It just means you get LESS take home pay. Likewise, the "taxing effect" means you get less inflation pressure from the higher prices, not a sign change!


When the inflation component for iBond rates came in at a very low 1.0% last year, Brinker said this "proved he was right" about higher energy prices not causing inflation. I posted a note at the time showing that the price of oil was down 0.6% year-over-year for the period used to set I-Bond rates so it didn't prove what he said. (see I Bonds Explained)

Today the Wall Street Journal reported "Inflation Accelerated Last Month On Higher Prices for Energy"

WASHINGTON -- U.S. consumer prices surged in November on the back of sharply higher energy prices while underlying inflation accelerated at its fastest pace in 10 months, providing fresh evidence that the disinflation trend in place for much of 2007 may be coming to an end.

The data could complicate the Federal Reserve's task of addressing downside economic growth risks at a time when officials remain worried about inflation, and may make them less willing to use their main interest-rate tool to address credit-market strains.

The consumer price index jumped 0.8% in November, the Labor Department said Friday, up sharply ...

To read the rest of the article: 75% off the Wall Street Journal + 8 Weeks FREE!

Lately Bob Brinker has tried to distance himself from his incorrect statement that higher priced oil is not inflationary by saying it doesn't cause core inflation to go up. Well, core inflation is CPI inflation with the more volatile food and energy prices removed. So, of course higher priced energy won't cause a big change in core inflation when you remove energy prices from the calculation!

MarketWatch reported this AM:

U.S. Nov CPI up 0.8%, core rate up 0.3, higher than forecast
Last update: 8:30 a.m. EST Dec. 14, 2007

WASHINGTON (MarketWatch) - The underlying rate of U.S. inflation accelerated in November, the Labor Department said Friday. The consumer price index increased 0.8%, driven by a 5.7% gain in energy prices, the fastest increase in energy prices since March. This is the biggest gain in consumer prices in more than two years. Food prices rose 0.3%, and apparel, airline and drug prices also spiked. The core CPI, which excludes food and energy costs, was up 0.3% in November, the biggest gain since January.

November core inflation at 0.3% times 12 months comes in at 3.6% a year, certainly not "low core inflation" by anyone's definition.

FOMC chairman Ben Bernanke says "price shocks" from higher prices for energy or other commodities like food can cause core inflation to go up if "consumer expectations for inflation" expect more inflation in the future. In practical terms, this mean core inflation will go up if you start telling your boss you need a bigger raise to pay the heating bills and gasoline bills to commute to work just to break-even. As today's inflation data shows, this is starting to happen.

The price of gold is considered the ultimate "inflation hedge" and it is soaring.


This is a very interesting chart from Chart of the Day

"Today's chart presents the Dow divided by the price of one ounce of gold. This results in what is referred to as the Dow / gold ratio or the cost of the Dow in ounces of gold. For example, it currently takes 16.7 ounces of gold to “buy the Dow.” This is considerably less that the 44.8 ounces back in the year 1999. When priced in gold, the 21st century US stock market has been in one big bear market."

I can't wait to hear how Bob Brinker spins the inflation data this weekend. Even if he doesn't admit he was wrong and the Fed was correct to be worried about inflation, it should prove to be an entertaining show.

FREE Updates Mailing List


We email regular "FREE Bob Brinker Fan Club Updates" to everyone on our "Bob Brinker Fan Club" distribution list. If you would like to get on this list, then click this link.


Top Rated Newsletter


Timer Digest Features
Kirk Lindstrom's Investment Letter
on its Cover

Cick to read the full page article!


US Treasury Rates at a Glance - iBond Rates - LIBOR Rates

Must Read:
Beware of Annuities - Payday Loans Warning