Search Bob Brinker Fan Club Blogs

Showing posts with label Oil Prices. Show all posts

Thursday, May 25, 2017

Brinker's Suncor Energy, $25 Oil & Self-driving Cars

If you follow Bob Brinker and bought Suncor Energy (SU) when he recommended it in Marketimer in the "mid-$30's" back in 2009 and still hold it today per Bob's advice after years of under performance, then this article is something to consider.
Click for full size images
5/23/17 Article: "Be warned: $25 oil is coming, and along with it, a new world order
  • "Oil demand will peak 2021-2020 and will go down 100 million barrels, to 70 million barrels within 10 years. And what that means, the new equilibrium price is going to be $25, and if you produce oil and you can't compete at $25, essentially you are holding stranded assets," Seba said.
  • "At $25 a barrel, that means deep-water, sands, shell oil, fields, most are going to be stranded, and also all the refineries and pipelines associated with these expensive oils are also going to be stranded. And that is going to reshape worldwide oil, geopolitics and so on."
The cost to extract oil from shale is coming down but this chart shows they all lose money today when oil sells below $29 per barrel.   Where does this chart bottom out?

Bob Brinker recommended buying Suncor Oil in his newsletter back in early 2009.  After trying to snag some cheap shares in his May 4, 2009 Marketimer in the "mid-$20s" Brinker chased the stock price in the next issue (June 2009) with a recommending to buy in the "low-$30s."  By my definition, that allowed his subscribers to buy at $33.34 (lower third of "the 30s") just before it dropped back to the mid-$20s.

Bob Brinker doesn't count this recommendation in his measured performance like I do with my "Explore Portfolio" for obvious reasons...  The graph above shows how poorly SU has done compared to the Total Stock Market fund that is the majority of his model portfolios.  IMHO (in my humble opinion) Brinker likes to recommend popular things in his "individual issues" so he can talk about them on the radio as a form of "advertising" but he doesn't track their performance since I've found they usually grossly under perform when taken as a group.
Don't Miss:


Kirk Lindstrom's Investment Letter:
Subscribe NOW & get the May 2017 Issue for FREE!!!

More Bob Brinker Information:


Wednesday, January 13, 2016

Low Oil Prices Are Here For Awhile - How Safe Are Your Dividends?

On Sunday January 9, 2016, Bob Brinker took a holiday and KTVU reporter Tom Vacar was the guest host.

More about Tom Vacar

I posted links where you can listen to the show at
In the first hour, Tom had a fascinating interview with Severin Borenstein, professor or economimics from UC Berkeley - The Energy Institute at Haas (Haas is the Haas School of Business where people get their MBA at UC).

Severin Borenstein explained why the Saudi's probably have not cut production and why there is good reason to believe low oil prices will be around for some time to come.

  • More supply coming online from Iran and Iraq that could make up for any cuts in production by the Saudi Arabia.
  • Fracking technology increased supply in the US so it should spread to the rest of the world, especially China where using natural gas will allow them to reduce green house gasses and polution by switching from coal.
  • "We are not on the verge of running out of oil in the US or the rest of the world."

If you own mutual funds and stocks for dividends, especially any related to energy, then I suggest listening to this discussion while asking yourself "how safe are my dividends?"


Kirk Lindstrom's Investment Letter  
Subscribe NOW and get the January2016 Issue for FREE!!!


Friday, December 05, 2008

Gulf Oil CEO Joe Petrowski: Oil Could Fall to $20 and Gasoline to $1 in 2009

Gulf Oil CEO says gas could hit $1 next year: On Wednesday, Gulf Oil CEO Joe Petrowski said that the price of oil could sink to $20 per barrel, and there is a chance gasoline prices could drop as low as $1 per gallon by early next year. Petrowski said speculators drove oil prices up and there is a chance that the market will overshoot on the way back down, resulting in much lower prices at the pump than we have now.

Oil Prices Per Barrel courtesy of Stockcharts.com

On Saturday July 12, 2008 Bob Brinker commented on oil prices:
Here we see oil having closed the week at an all-time-record-high, close to $145 for a barrel of oil………..And there is an inverse relationship that has developed between upward spikes in oil prices and the stock market, and that inverse relationship has really been showing up now for some time.

Now why is there this correlation – we see the S&P 500 sitting in in the 1240 area. We see the Dow sitting in at 11,100 area. We see the Nasdaq Composite trading in the 2200’s. Why is there this correlation between the price of a barrel of oil and what goes on in the stock market? I think the answer to that question is easy, and that is consumers, wind up with less money to spend when they get pounded with these higher costs of energy, costs of gasoline, all the products in the energy complex. And that weakens the status of the consumer and also delays the potential for economic recovery.

"The stock market wants to see an economic recovery scenario. It does not want to see an increased oil price scenario, which is was it’s seeing right now. Now I wish I could tell you what the price of oil is going to be in a week, a month, a year. I don’t know. I have no way of knowing and I think only a fool would try to forecast the price of a barrel of oil in the world we live in…….
Since March 2003, Bob Brinker was fully invested in the stock market with all in buys for the S&P500 in the mid 1400s, mid 1300s and even the mid 1200s as shown on this graph.

The price of oil AND the stock markets have crashed so the "inverse relationship" is not valid at all.

What Brinker said in June was nonsense and is nonsense today as the clear link between economic growth and the price of oil demonstrates.

High oil prices were due to booming global economies creating huge demand with speculators piling on to push prices higher. This was not rocket science but simple economics of supply and demand.

Likewise, today we are plunging into a global recession with many fearing depression. Obviously the demand for oil is plunging which leads to plunging oil prices.

Now the market is at:

12/05/2008 ET
Last Change As of:
.DJIA8,130.53 -245.71 10:46am
NASDAQ
1,409.73 -35.83 10:46am
S&P500
819.34 -25.88 10:46am

Maybe one day we will hear Bob Brinker say on the radio that predicting the price of the stock market is just as hard as predicting the price of oil. Can you imagine if Brinker said:
I think only a fool would try to forecast the price of the stock market in the world we live in…….
I am not holding my breath. It is very hard to sell a newsletter called "Marketimer" when your market timing has you wildly bullish with a "gift horse buy" in the mid 1400s just before the biggest market crash since the Great Depression!

Friday, August 29, 2008

Bob Brinker's MOABO: August in Review

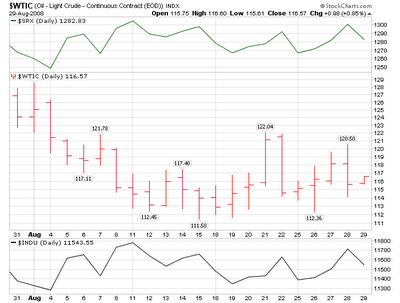
Oil prices fell another 8% in August, down to about $116, while the markets overall basically went nowhere. (Officially the markets had a small gain in August but this chart shows the last month which is 30 days back into late July)

Bob Brinker says the price of oil is a wildcard. On the July 12 Moneytalk, Brinker said:
"Here we see oil having closed the week at an all-time-record-high, close to $145 for a barrel of oil………..And there is an inverse relationship that has developed between upward spikes in oil prices and the stock market, and that inverse relationship has really been showing up now for some time.

The stock market wants to see an economic recovery scenario. It does not want to see an increased oil price scenario, which is was it’s seeing right now. Now I wish I could tell you what the price of oil is going to be in a week, a month, a year. I don’t know. I have no way of knowing and I think only a fool would try to forecast the price of a barrel of oil in the world we live in……. [Full story]
Concerns over the economy, inflation and troubles in the financial sector weighed heavy on investors in August despite oil prices falling about $9 from $125 to $116


Despite being fully invested since March 2003 and riding this bear market down fully invested, Bob Brinker issued yet another "all in the pool" buy level in the low 1200s in early August. So far, that was too late to do anyone any good as the market had already recovered by the time he issued a the latest buy level.

Brinker's Model Portfolio #1 (P1) Performance
(Data from Bob Brinker's Marketimer for end of month totals)
Brinker P1 as of 10/31/07 = $302,561
Brinker P1 as of 07/31/08 = $249,993
Thus P1 is down $52,568 or 17.4%
Gain required for P1 from 7/31/08 to "break-even" with its 10/31/07 value is 21.0%

I will update this table with the August numbers as soon as they are published, but from the top graph, I would not expect them to be very different.

Bob Brinker's MOABO

I sure hope the markets have made a bottom and they do not go lower. As an asset allocator and stock picker who does not short stocks, I would love to see the market go up all the time with the occasional correction to buy back profit taking shares to add to my returns.

It would sure be ironic if Bob Brinker's original prediction of a secular bear market with a MOABO (mother of all buying opportunities) at the end of that bear market, turns out to be true. I imagine he is kicking himself raw for calling for new highs in 2008 last year just as the bear market was starting.

Friday, August 15, 2008

Oil Prices At Major Support Levels

Bob Brinker (Fan Club) said the price of oil is "directly correlated" to the stock market and only a "fool" believes he (the fool) can predict the price of Oil.
"Oil prices have fallen lately. We include this news for the benefit of gas stations, which otherwise wouldn't learn of it for six months." -- William D. Tammeus
During his July 12, 2008 Moneytalk show, Bob Brinker said:
"Now I wish I could tell you what the price of oil is going to be in a week, a month, a year. I don’t know. I have no way of knowing and I think only a fool would try to forecast the price of a barrel of oil in the world we live in…….”
The price of oil, West Texas Intermediate crude (more WTIC Charts) specifically, broke its steep 2008 support level (dashed green line in graph below) last month. Currently oil prices are testing the 20-month support line (dashed blue line) from the start of 2007.

Click charts courtesy of stockcharts.com for full size images

Bloomberg: Oil Steady After Falling on Signs Fuel Use Decline Will Spread
  • Gasoline demand was down 2.1 percent through July as record prices and slower economic growth cut consumer spending.
  • "The market is much more focused on demand destruction than on supply concerns,'' said Nauman Barakat, senior vice president of global energy futures at Macquarie Futures USA Inc. in New York. "The concern now is that the demand destruction in the U.S. will spread like a virus to other countries.''
We will need to see improvement in the credit markets for the stock market to make new highs but this decline in the price of oil should help the markets move out of the 1200s. XLF is the financial sector spider, a subset of SPY.

The chart below clearly shows the stock market has been led by problems in the financial sector, not the price of oil. The price of oil is an important variable in corporate profitability and consumer spending, but there is no direct correlation.

These charts make it easy to see the the stock market rallied early in the year as oil prices went up and it fell as oil prices continued to rise. The direct correlation is between the S&P500 and XLF, not oil prices.

In his August 2008 Marketimer, Bob Brinker said:
"We believe a good case can be made for oil prices to trend toward the $100 per barrel level into 2009."
If the stock market continues to rally and oil prices break support, then Bob Brinker's latest buy level may have come too late. (I'd rather not be the first to give this new "All-In Buy Level" number in respect for his paying subscribers.)

3-strikes is not an out for Bob
Of course, how many people have money left over after "all in buys" in the mid 1400s and low 1300s given Brinker has been recommending a "fully invested" position in the stock market since March 2003? (See Bob Brinker's Asset Allocation History.)

Kirk's Investment Newsletter
Corvette driving into mailbox

To find out how I've profited greatly from these difficult market conditions, subscribe to "Kirk Lindstrom's Investment Newsletter" today!
  • Since 1/1/1999 through 7/31/08 my "explore" portfolio is up 180% while the S&P500 is only up 19% and Warren Buffett's Berkshire Hathaway is only up 62%
    .
  • Subscribe TODAY and get the August 2008 issue for FREE!
.

Tuesday, July 22, 2008

Bob Brinker Throws Charlie Maxwell Under the Bus

Is Brinker admitting he can't predict the future price of the stock market because he can't predict the future price of oil? On Saturday July 12, Bob Brinker commented on oil prices:
Here we see oil having closed the week at an all-time-record-high, close to $145 for a barrel of oil………..And there is an inverse relationship that has developed between upward spikes in oil prices and the stock market, and that inverse relationship has really been showing up now for some time.

"The stock market wants to see an economic recovery scenario. It does not want to see an increased oil price scenario, which is was it’s seeing right now. Now I wish I could tell you what the price of oil is going to be in a week, a month, a year. I don’t know. I have no way of knowing and I think only a fool would try to forecast the price of a barrel of oil in the world we live in…….”
Is Bob Brinker calling himself and his guest Charlie Mawell fools for trying to predict the price of oil less than a year ago?

David Korn Moneytalk Commentary: (November 10-11, 2007):
Charlie Maxwell, the oil energy expert, was on Moneytalk in September and predicted that oil should stay in a range of $50s up to $80 a barrel for another two years. Bob took up this mantra in response to a caller some weeks back saying he was going to go with Charlie's prediction. Up until recently, Charlie had been pretty on the mark as oil had only gone to the upper $70s. With oil now knocking on $100 a barrel, the prediction Charlie last made is pretty much out the window.
David Korn Moneytalk Commentary (May 19-20, 2007):
Maxwell/Brinker: Bob opened the interview praising Charlie for his predictions on Moneytalk that the price of oil would trade in the $50s to the $70s which has been right on the mark in recent years. Bob asked Charlie if he had changed his forecast. Charlie said we have seen oil go from $25 a barrel in early 2003, to as high as $75 a barrel, with a peak at $78. There was a lot of oil being traded at $75. The rise from $25 to $75 is huge and represents a 200% increase. Nevertheless, Charlie said he thinks supply and demand are roughly in balance today and might stay here for a while, particularly given the weakness that is going on in the U.S. economy. A slower U.S. economy can translate into reduced imports, and thus slow foreign demand from countries like China. This period of transition where we stay in the range of $50s up to $80 a barrel should stay with us for another two years.
  • Kirk Comment: Just today the CFTC task force study concluded supply and demand are main factors in oil price run up to record levels
With this as a backdrop, Charlie thinks that by 2010-2011, we could see oil trade at over a $100 a barrel.

David Korn: Charlie has actually gone on record in the past projecting that West Texas Intermediate Crude ($WTIC) would rise to rise to $85 by 2010, $180 by 2015 and $300 by 2020. Based on today's interview, it looks like he raised his 2010 prediction by $15 a barrel.I don't think Charlie Maxwell and Bob Brinker are fools. They were just very, very wrong.
James Rogers (Mr. Bow Tie as Bob Brinker used to call him) and many others predicted commodity prices would soar for many reasons including "easy money made available by the Federal Reserve."

For years Bob Brinker has been in favor of a low Fed Funds rate as he has dismissed the effects on inflation these low rates have. Brinker was wrong while others like me who warned about inflation from higher priced oil (and other rising commodities) were correct.


The above chart shows the S&P500 is back to where it started 2006 while the price of oil has more than doubled. The chart also shows the S&P500 made a record high even as the price of oil soared 50% from $60 to $90.

Bob Brinker needs to look at the credit crisis for what caused the stock market to have a bear market. Here is the same chart with the Financial Sector exchange traded fund, XLF, added.

This chart of oil prices, the S&P500 and XLF since June 1st shows just how wrong Brinker is about what is driving stock prices. Hint... it is not oil!

I think Bob Brinker has thrown Charlie Maxwell under the bus so he can blame someone for missing a bear market over the price of oil. The trouble is, the collapse of the financial sector is driving the price of the stock market, not oil! Oil is where it was in early June while the S&P500 is down considerably. Brinker should admit he was wrong and stop trying to find scapegoats.

Friday, June 13, 2008

Bob Brinker, May Inflation and GDP Growth

The US Labor Department reported today that May CPI inflation was up 4.2% over the May 2007 level. The components of CPI with the largest gains were:
This graph of the year over year percent change in the unadjusted CPI data shows inflation is anything but low on an historical basis.

[Click graphs to see larger images]


Bob Brinker said:
The other day, Larry Kudlow (CNBC) put up a chart of inflation for the past years. A few years ago when energy prices were low and the economy was growing at about 3%, inflation was about 1.9% on average. Since then, energy prices have soared, our economy has slowed to a near standstill and yet inflation has MORE than doubled!
  • ==>"The CPI is up 4.2% in the past year and has risen at a 4.9% annual pace over the past three months. "
The Fed lowered rates to help save our banking industry from the mess the idiots at the helm of places like Citibank, Wachovia, Bear Strearns, Lehman, etc. made. Those rate cuts caused the dollar to crash which has made inflation as measured in things like Gold or oil soar to hyper inflationary rates... but we don't see hyper inflation here because we measure inflation in dollars.

Economic growth has nearly vanished as we crawl along with less than 1.0% GDP growth while our inflation has doubled over the very low rate of inflation we had just a few years ago when economic growth was 3 to 5% and oil was less than half what it is today.

This final chart from my friends at Martin Capital show CPI inflation is not low as Brinker claims. Furthermore, it shows producer price inflation is even worse which puts a strain on profits and explains part of the downward revisions in S&P500 earnings estimates since companies are reluctant to raise prices now to pass on inflation to their customers. If the economy improves, then this "inflation debt" will eventually get passed to customers through higher prices since companies are in business to make money.


The chart of yearly change in CPI inflation (dark green curve on the chart) shows inflation is near a 10-year high. The price of oil has more than doubled in the past year which has caused inflation to roughly double from low 2% to a 4.9% annual pace over the last three months!

The good news is the Federal Reserve and ECRI both expect inflation to moderate since very few expect the price of oil to double again in the next year from the current level of $135/barrel. My "Inflation Expectation" chart of the 10-year US Treasury rate minus the 10-year TIPs rate show bond investors expect long term inflation to run about 2.53%.

Friday, December 14, 2007

Bob Brinker WRONG about Oil Prices and Inflation

For years Bob Brinker has been telling his audience that higher prices for energy, especially oil for heating and gasoline, were not inflationary. (Reference 2006 Monologue "Oil prices literally going through the roof, and yet to the consternation of many, not listeners to Moneytalk, but to many, including, apparently, the Fed Chairman, they think oil prices are inflationary. That's because they don't understand, they don't understand the taxing effect that these higher gasoline prices have on your pocketbook.")

Brinker correctly says higher energy prices "act like a tax" and slow growth, but he forgets that tax rates are not 100%. This means that oil prices are "less inflationary" than if they didn't act as a tax, but they are still inflationary. Taxing your pay check doesn't mean your pay check turns negative! It just means you get LESS take home pay. Likewise, the "taxing effect" means you get less inflation pressure from the higher prices, not a sign change!


When the inflation component for iBond rates came in at a very low 1.0% last year, Brinker said this "proved he was right" about higher energy prices not causing inflation. I posted a note at the time showing that the price of oil was down 0.6% year-over-year for the period used to set I-Bond rates so it didn't prove what he said. (see I Bonds Explained)

Today the Wall Street Journal reported "Inflation Accelerated Last Month On Higher Prices for Energy"

WASHINGTON -- U.S. consumer prices surged in November on the back of sharply higher energy prices while underlying inflation accelerated at its fastest pace in 10 months, providing fresh evidence that the disinflation trend in place for much of 2007 may be coming to an end.

The data could complicate the Federal Reserve's task of addressing downside economic growth risks at a time when officials remain worried about inflation, and may make them less willing to use their main interest-rate tool to address credit-market strains.

The consumer price index jumped 0.8% in November, the Labor Department said Friday, up sharply ...

To read the rest of the article: 75% off the Wall Street Journal + 8 Weeks FREE!

Lately Bob Brinker has tried to distance himself from his incorrect statement that higher priced oil is not inflationary by saying it doesn't cause core inflation to go up. Well, core inflation is CPI inflation with the more volatile food and energy prices removed. So, of course higher priced energy won't cause a big change in core inflation when you remove energy prices from the calculation!

MarketWatch reported this AM:

U.S. Nov CPI up 0.8%, core rate up 0.3, higher than forecast
Last update: 8:30 a.m. EST Dec. 14, 2007

WASHINGTON (MarketWatch) - The underlying rate of U.S. inflation accelerated in November, the Labor Department said Friday. The consumer price index increased 0.8%, driven by a 5.7% gain in energy prices, the fastest increase in energy prices since March. This is the biggest gain in consumer prices in more than two years. Food prices rose 0.3%, and apparel, airline and drug prices also spiked. The core CPI, which excludes food and energy costs, was up 0.3% in November, the biggest gain since January.

November core inflation at 0.3% times 12 months comes in at 3.6% a year, certainly not "low core inflation" by anyone's definition.

FOMC chairman Ben Bernanke says "price shocks" from higher prices for energy or other commodities like food can cause core inflation to go up if "consumer expectations for inflation" expect more inflation in the future. In practical terms, this mean core inflation will go up if you start telling your boss you need a bigger raise to pay the heating bills and gasoline bills to commute to work just to break-even. As today's inflation data shows, this is starting to happen.

The price of gold is considered the ultimate "inflation hedge" and it is soaring.


This is a very interesting chart from Chart of the Day

"Today's chart presents the Dow divided by the price of one ounce of gold. This results in what is referred to as the Dow / gold ratio or the cost of the Dow in ounces of gold. For example, it currently takes 16.7 ounces of gold to “buy the Dow.” This is considerably less that the 44.8 ounces back in the year 1999. When priced in gold, the 21st century US stock market has been in one big bear market."

I can't wait to hear how Bob Brinker spins the inflation data this weekend. Even if he doesn't admit he was wrong and the Fed was correct to be worried about inflation, it should prove to be an entertaining show.

Friday, May 12, 2006

Bob Brinker on Price of Oil vs Inflation

Inflation is the loss of purchasing power. Most people understand that higher prices mean you can buy less with a given amount of money but Bob Brinker says otherwise.

5/12/06: Price of Oil and Inflation

Bob Brinker says Ben Bernanke, the chairman of the Federal Reserve, has it wrong. Bob Brinker says higher priced oil is not inflationary.

In his April 30th, 2006 monologue, Bob Brinker said:

"We have kept you informed what is really going on in the world of inflation, which is virtually nothing. As you know, oil prices have skyrocketed and are now setting up near all time highs in the low $70s. Oil prices literally going through the roof, and yet to the consternation of many, not listeners to Moneytalk, but to many, including, apparently, the Fed Chairman, they think oil prices are inflationary. That's because they don't understand, they don't understand the taxing effect that these higher gasoline prices have on your pocketbook.

As we've discussed on the program, the vast majority of people in America today cannot even afford to fill up their gas tank. They can't put the $40, $50, $60, $70 worth into their gas tank because they don't operate on a budget like that. Sure, there are some well-heeled that can do it and not care very much about it, but the vast majority of Americans cannot even afford a $40, $50, $60, $70 fill-up on a regular basis-they just can't afford it.

Perhaps Bob Brinker's listeners really cannot afford to fill their gas tanks but I see little difference between Brinker's low-income listeners paying more for gasoline or for rent. An increase in either gasoline or rent is inflationary because it is the total spending and how much you get for it, purchasing power, that matters. If the poor can't afford increases from inflation then they usually downsize their standard of living such as moving to a cheaper apartment, taking the bus rather than driving or eating cheaper food. Some will even get a second job to "make ends meet." The middle class usually saves less and those of us who can afford it, we might give less to charity or spend less on our luxuries. One thing remains constant, higher priced gasoline means we all can't afford what we could before unless we get a raise to compensate for higher prices.

Inflation is near 15-year highs. I have charted the price of Oil and Inflation between 1994.

From the charts, you can see that the ups and downs for inflation seem well correlated with the price of oil. To argue otherwise seems rather foolish to me.

Bob, a "taxing effect" means you get less of something, not a sign change.

FREE Updates Mailing List


We email regular "FREE Bob Brinker Fan Club Updates" to everyone on our "Bob Brinker Fan Club" distribution list. If you would like to get on this list, then click this link.


Top Rated Newsletter


Timer Digest Features
Kirk Lindstrom's Investment Letter
on its Cover

Cick to read the full page article!


US Treasury Rates at a Glance - iBond Rates - LIBOR Rates

Must Read:
Beware of Annuities - Payday Loans Warning